 5
5peptides
spectra
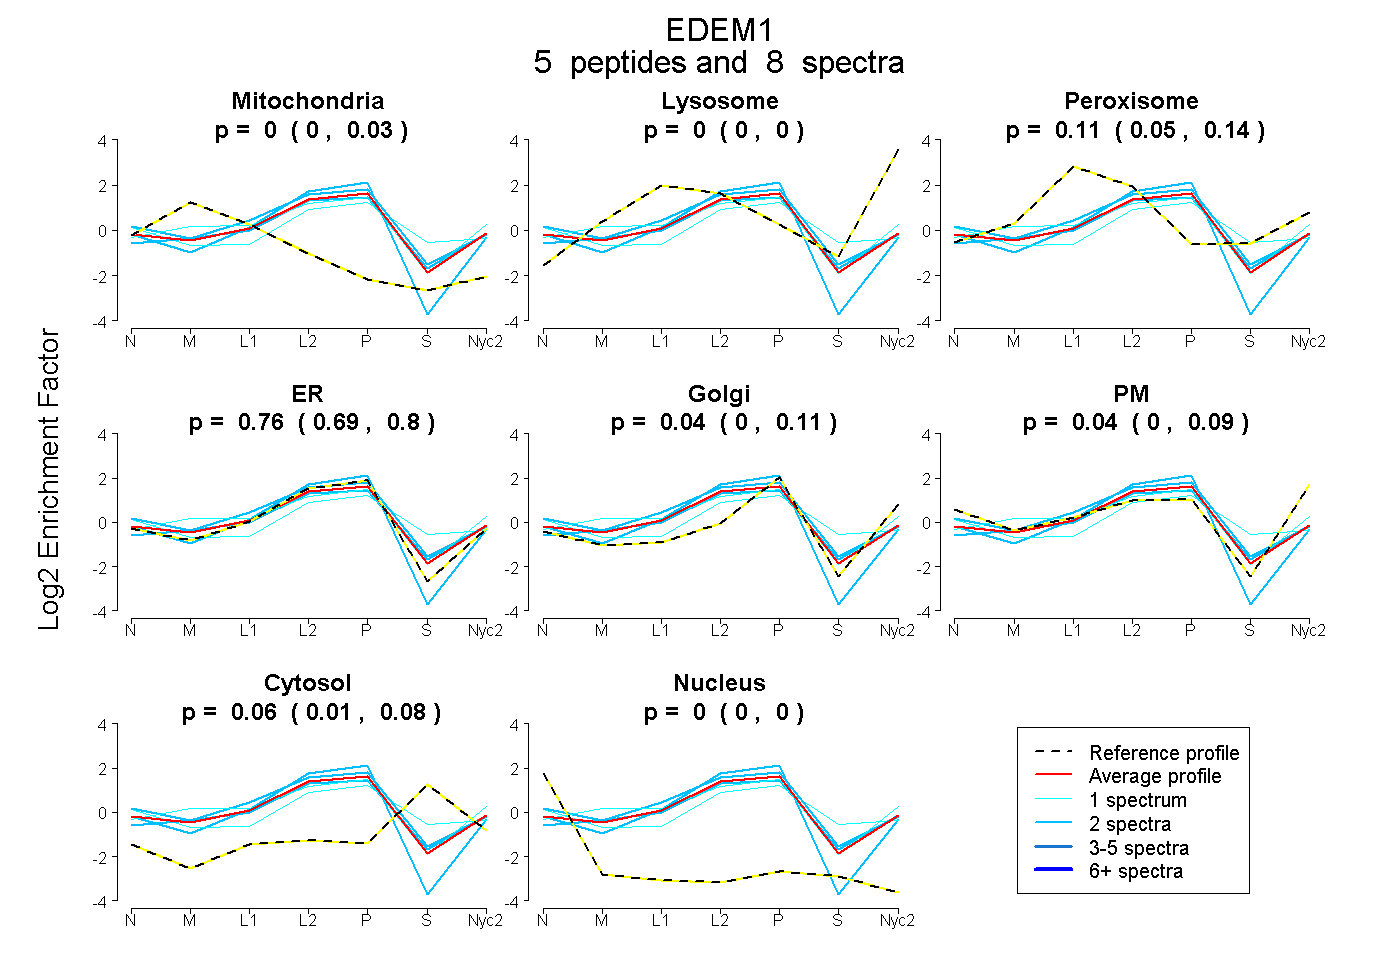
0.000 | 0.033
0.000 | 0.000
0.053 | 0.144
0.692 | 0.801
0.000 | 0.108
0.000 | 0.093
0.006 | 0.085
0.000 | 0.000
| Plot | Mito | Lyso | Perox | ER | Golgi | PM | Cytosol | Nucleus | |||||
| Expt A |
5 peptides |
8 spectra |
|
0.000 0.000 | 0.033 |
0.000 0.000 | 0.000 |
0.107 0.053 | 0.144 |
0.757 0.692 | 0.801 |
0.044 0.000 | 0.108 |
0.036 0.000 | 0.093 |
0.057 0.006 | 0.085 |
0.000 0.000 | 0.000 |
| 2 spectra, ALWNLR | 0.000 | 0.000 | 0.000 | 1.000 | 0.000 | 0.000 | 0.000 | 0.000 | ||
| 2 spectra, TGIPYPR | 0.000 | 0.017 | 0.174 | 0.764 | 0.000 | 0.000 | 0.046 | 0.000 | ||
| 1 spectrum, YSLPLK | 0.079 | 0.105 | 0.094 | 0.528 | 0.155 | 0.039 | 0.000 | 0.000 | ||
| 1 spectrum, CGYATLHHVIDK | 0.000 | 0.000 | 0.032 | 0.546 | 0.000 | 0.123 | 0.299 | 0.000 | ||
| 2 spectra, VLGSLLSAHR | 0.014 | 0.000 | 0.090 | 0.671 | 0.000 | 0.144 | 0.081 | 0.000 |
| Plot | Lyso | Other | |||||||||||
| Expt C |
2 peptides |
3 spectra |
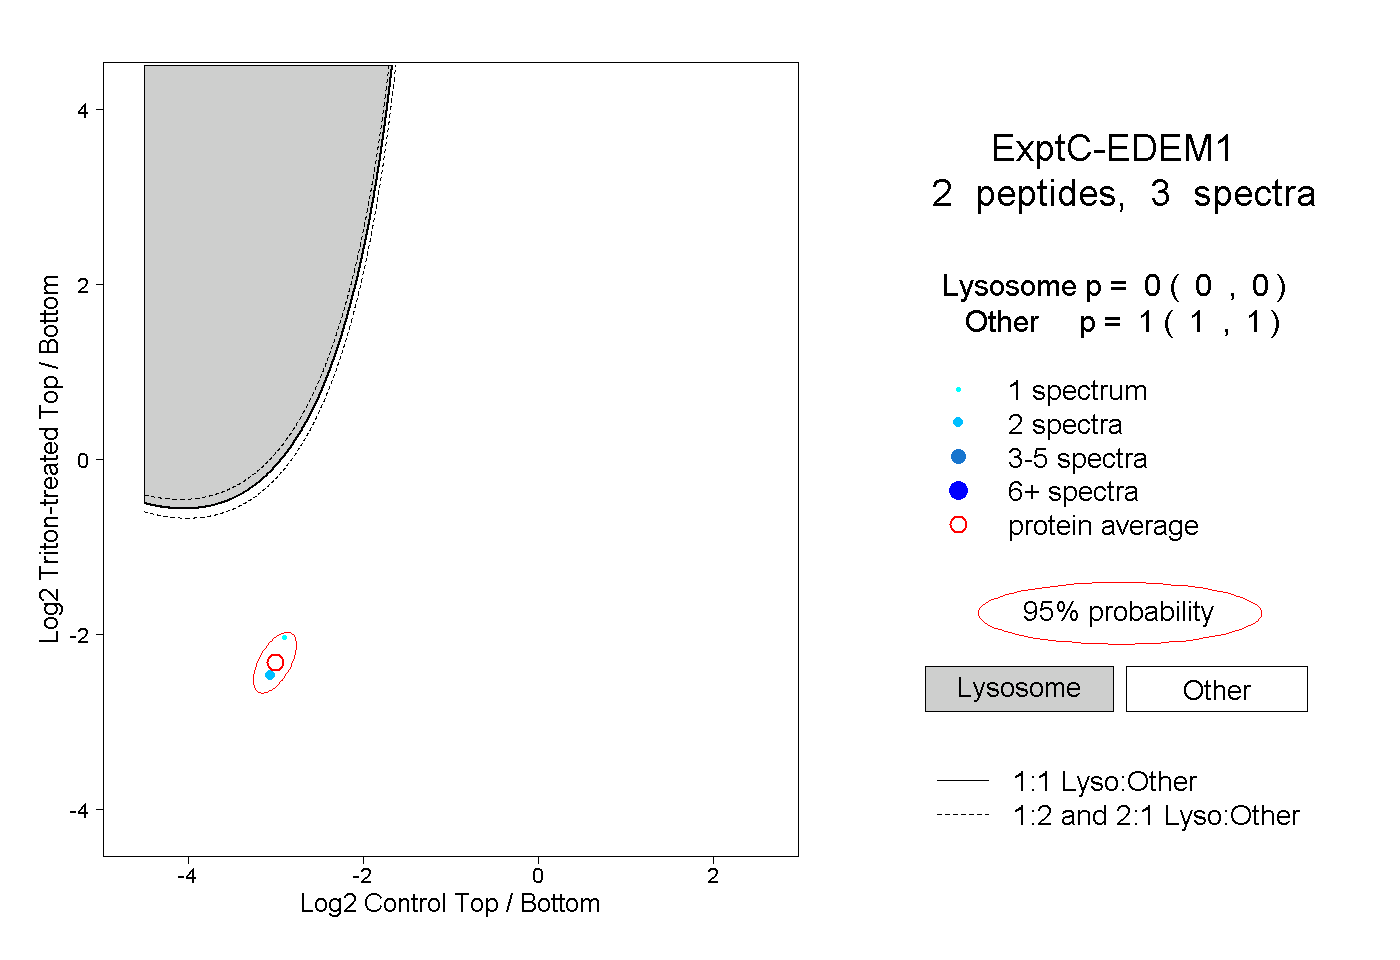 |
0.000 0.000 | 0.000 |
1.000 1.000 | 1.000 |