 3
3peptides
spectra
0.000 | 0.000
0.000 | 0.000
0.000 | 0.000
0.198 | 0.699
0.000 | 0.476
0.000 | 0.000
0.000 | 0.176
0.153 | 0.326
1peptide
spectra
NA | NA
NA | NA
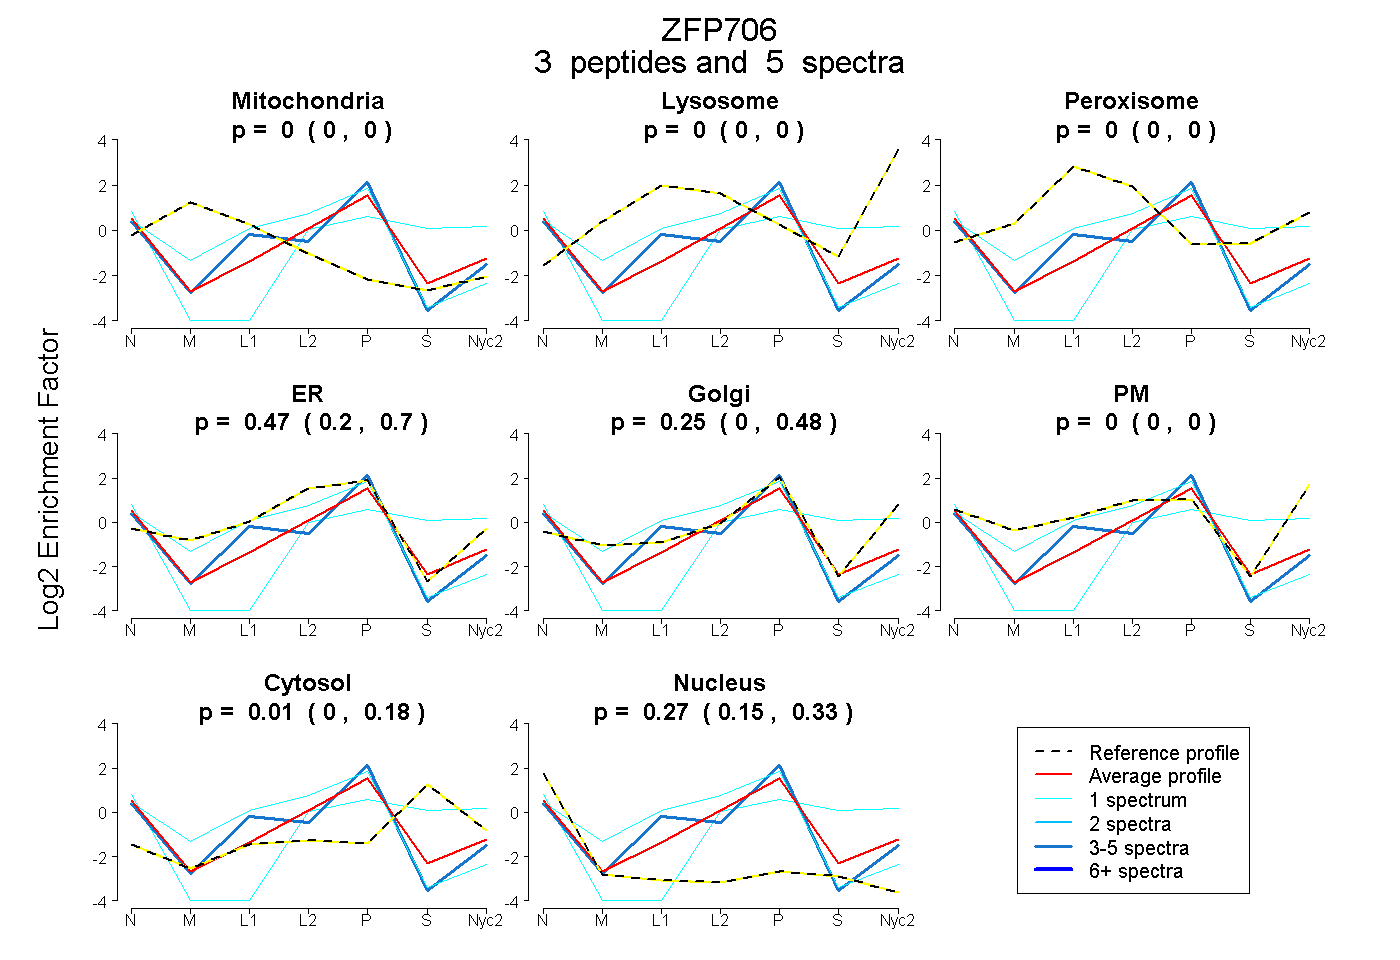
| Plot | Mito | Lyso | Perox | ER | Golgi | PM | Cytosol | Nucleus | |||||
| Expt A |
3 peptides |
5 spectra |
|
0.000 0.000 | 0.000 |
0.000 0.000 | 0.000 |
0.000 0.000 | 0.000 |
0.471 0.198 | 0.699 |
0.245 0.000 | 0.476 |
0.000 0.000 | 0.000 |
0.012 0.000 | 0.176 |
0.271 0.153 | 0.326 |
||
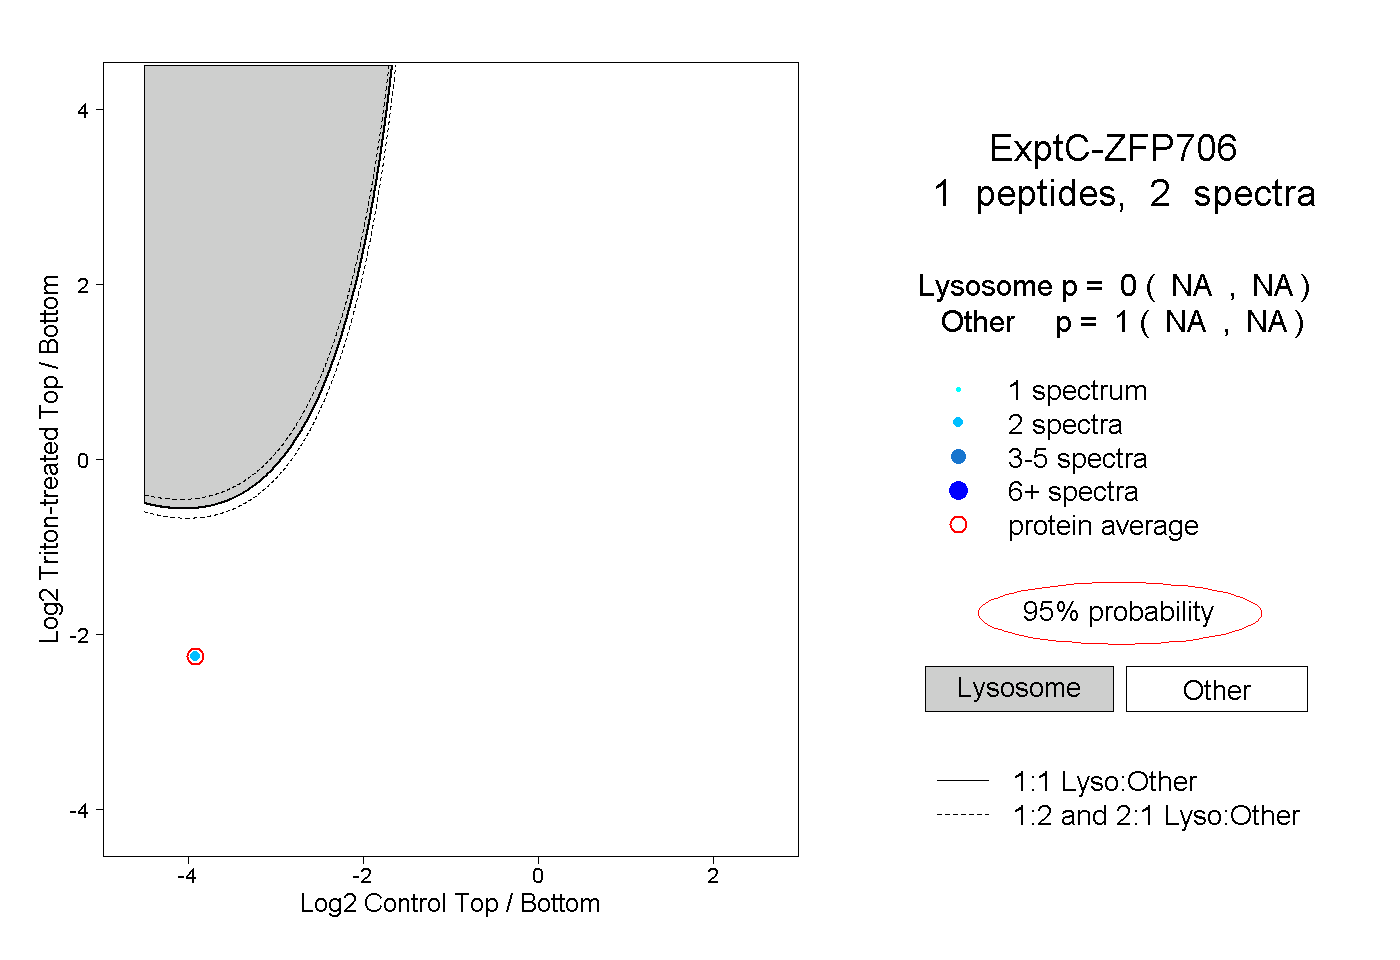
| Plot | Lyso | Other | |||||||||||
| Expt C |
1 peptide |
2 spectra |
|
0.000 NA | NA |
1.000 NA | NA |