 3
3peptides
spectra
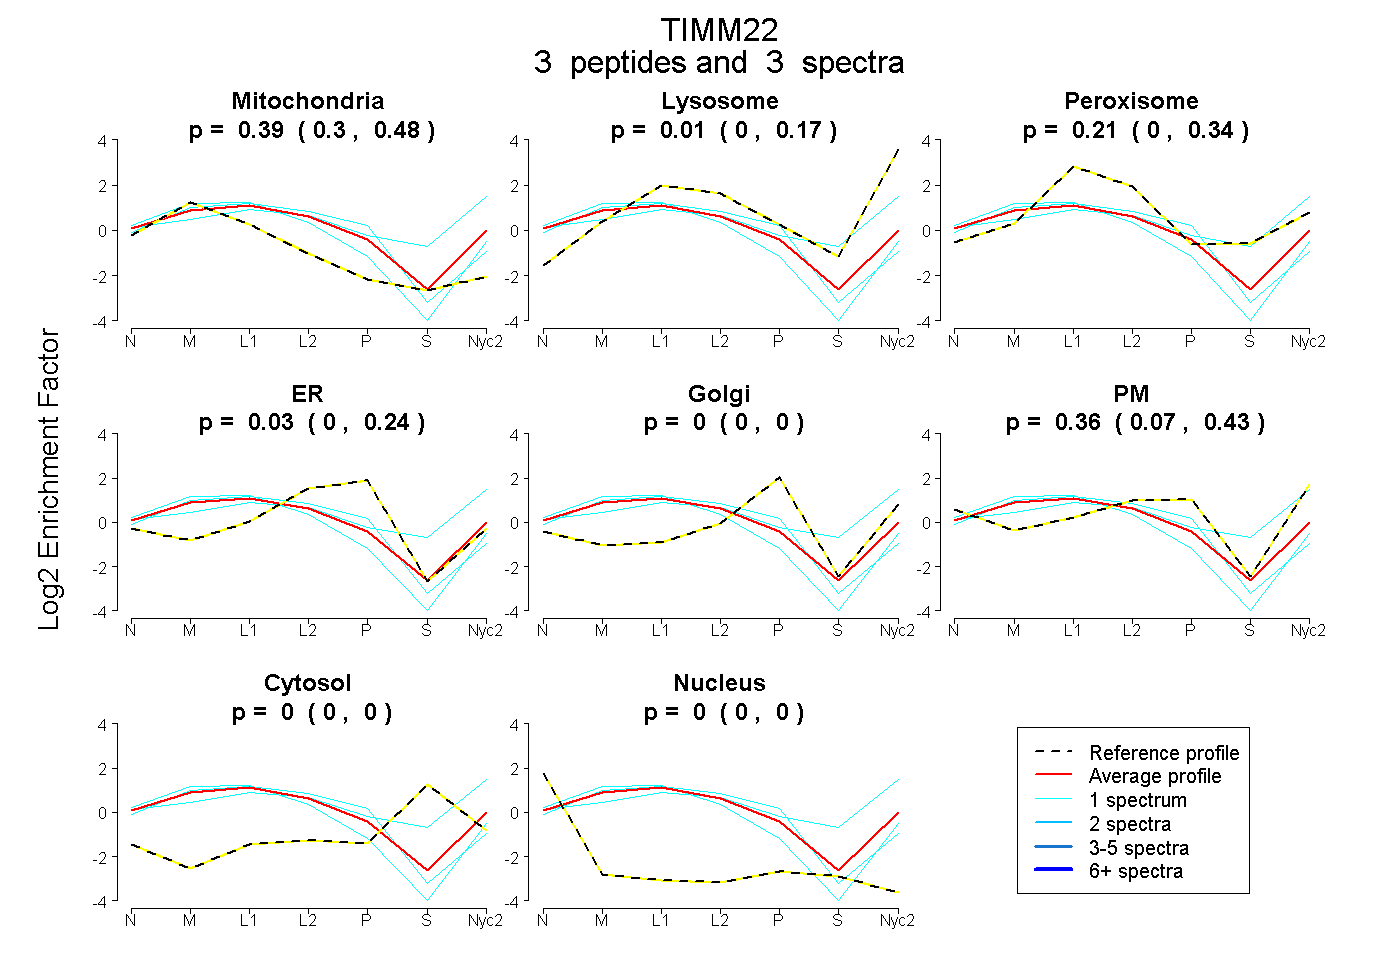
0.296 | 0.482
0.000 | 0.171
0.000 | 0.341
0.000 | 0.243
0.000 | 0.000
0.073 | 0.435
0.000 | 0.000
0.000 | 0.000
1peptide
spectrum
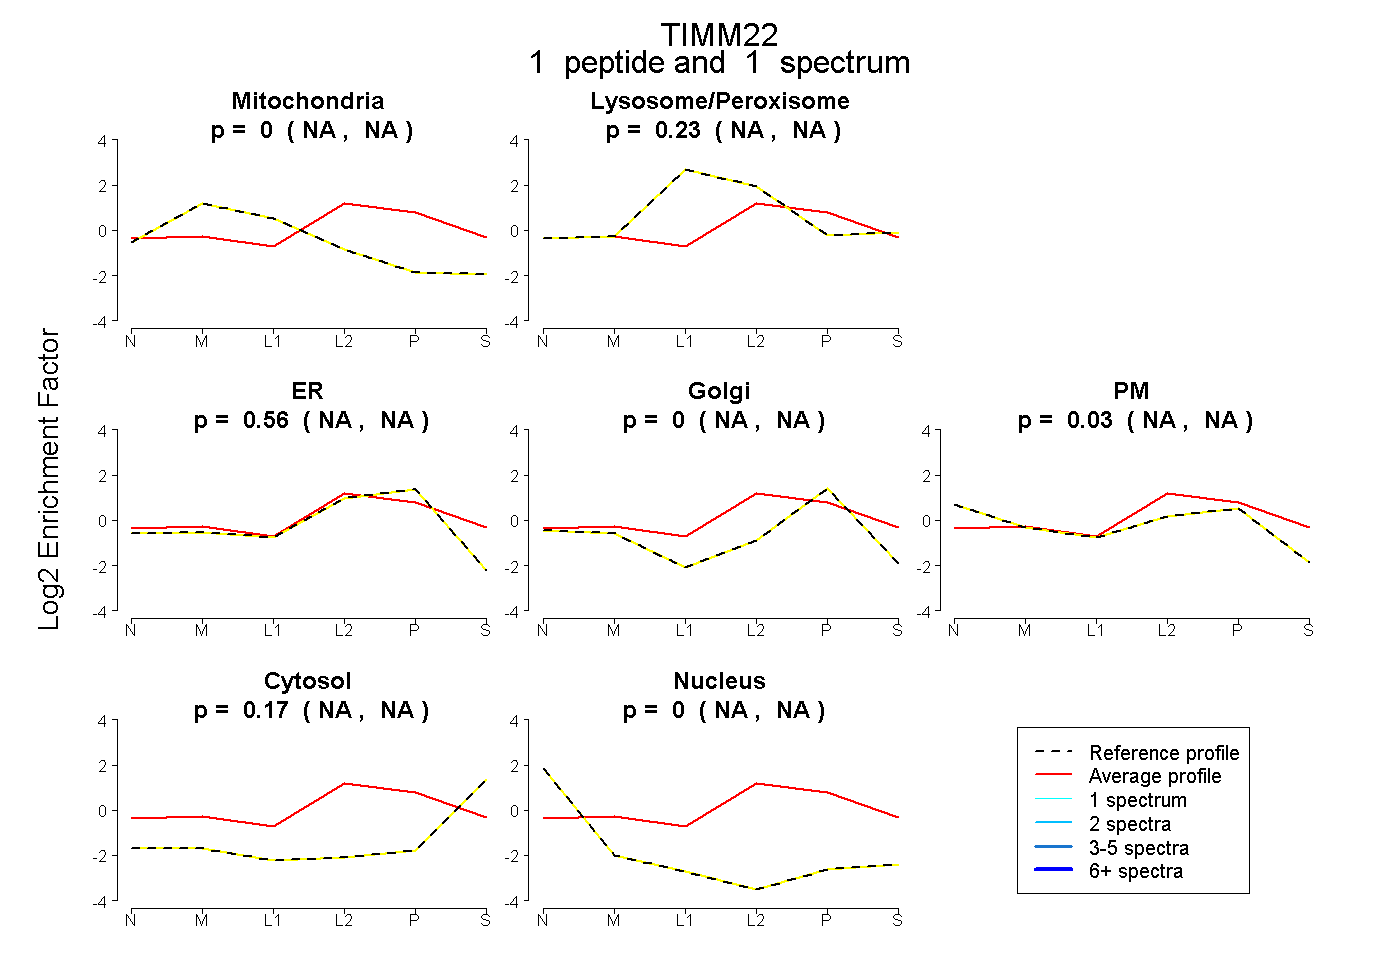
NA | NA
NA | NA
NA | NA
NA | NA
NA | NA
NA | NA
NA | NA
2peptides
spectra
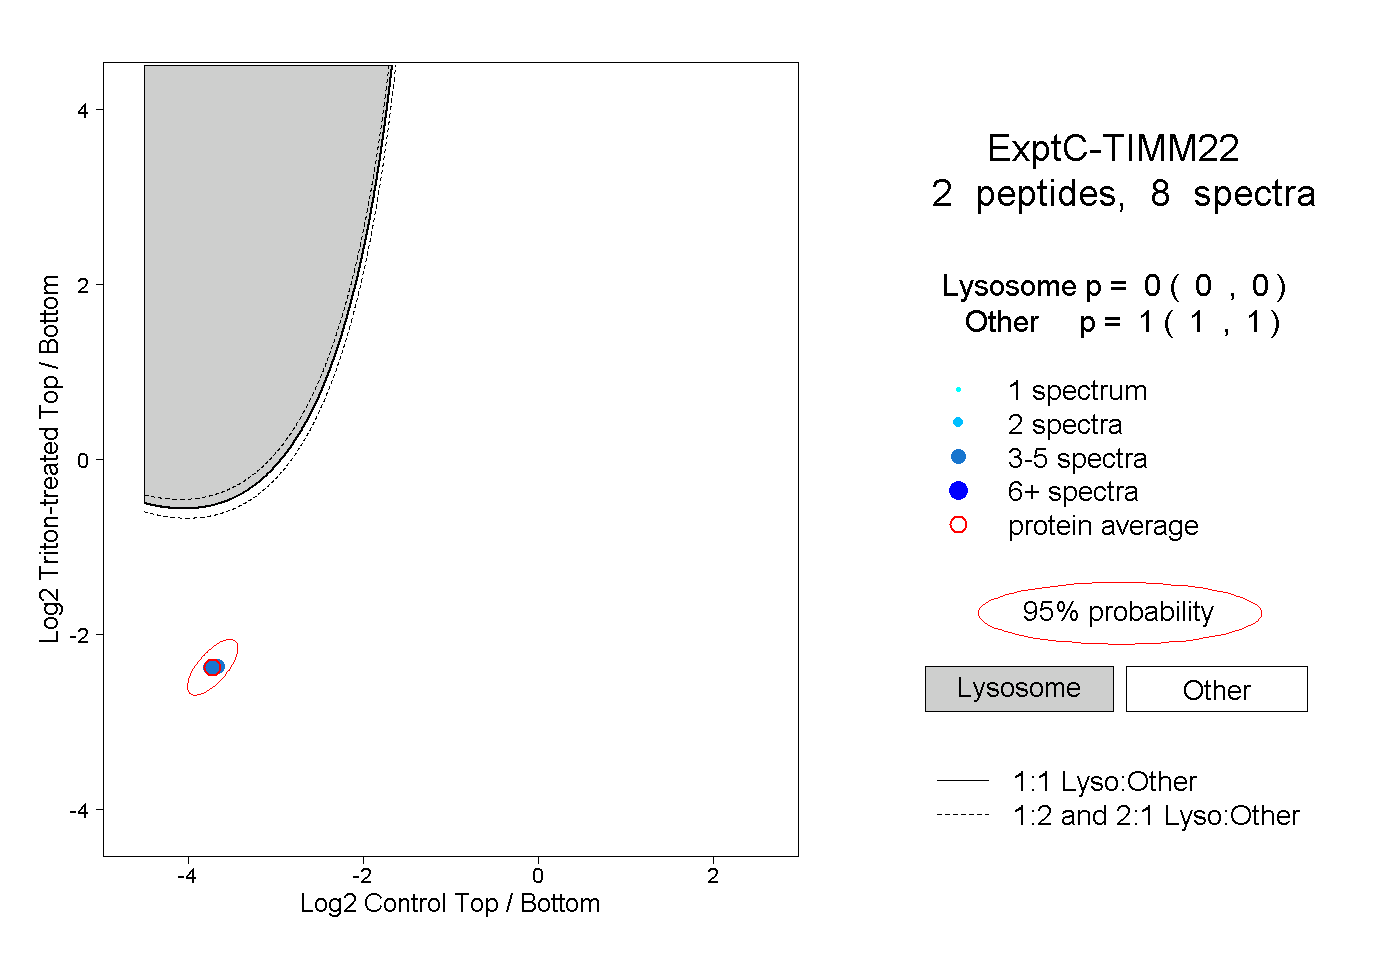
0.000 | 0.000
1.000 | 1.000