 4
4peptides
spectra
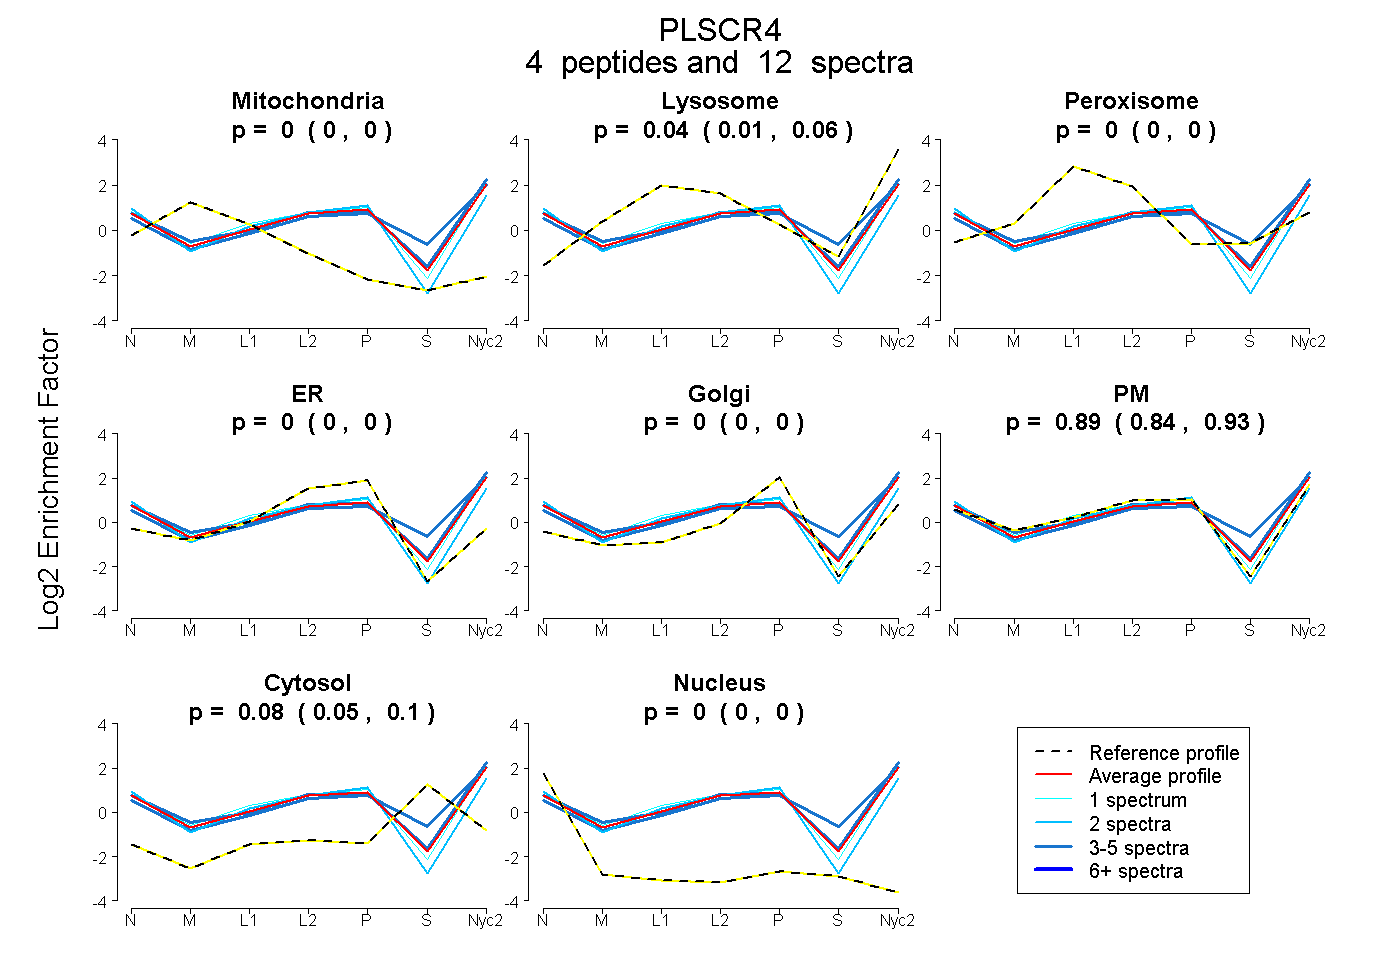
0.000 | 0.000
0.009 | 0.060
0.000 | 0.000
0.000 | 0.000
0.000 | 0.000
0.839 | 0.926
0.054 | 0.097
0.000 | 0.000
1peptide
spectra
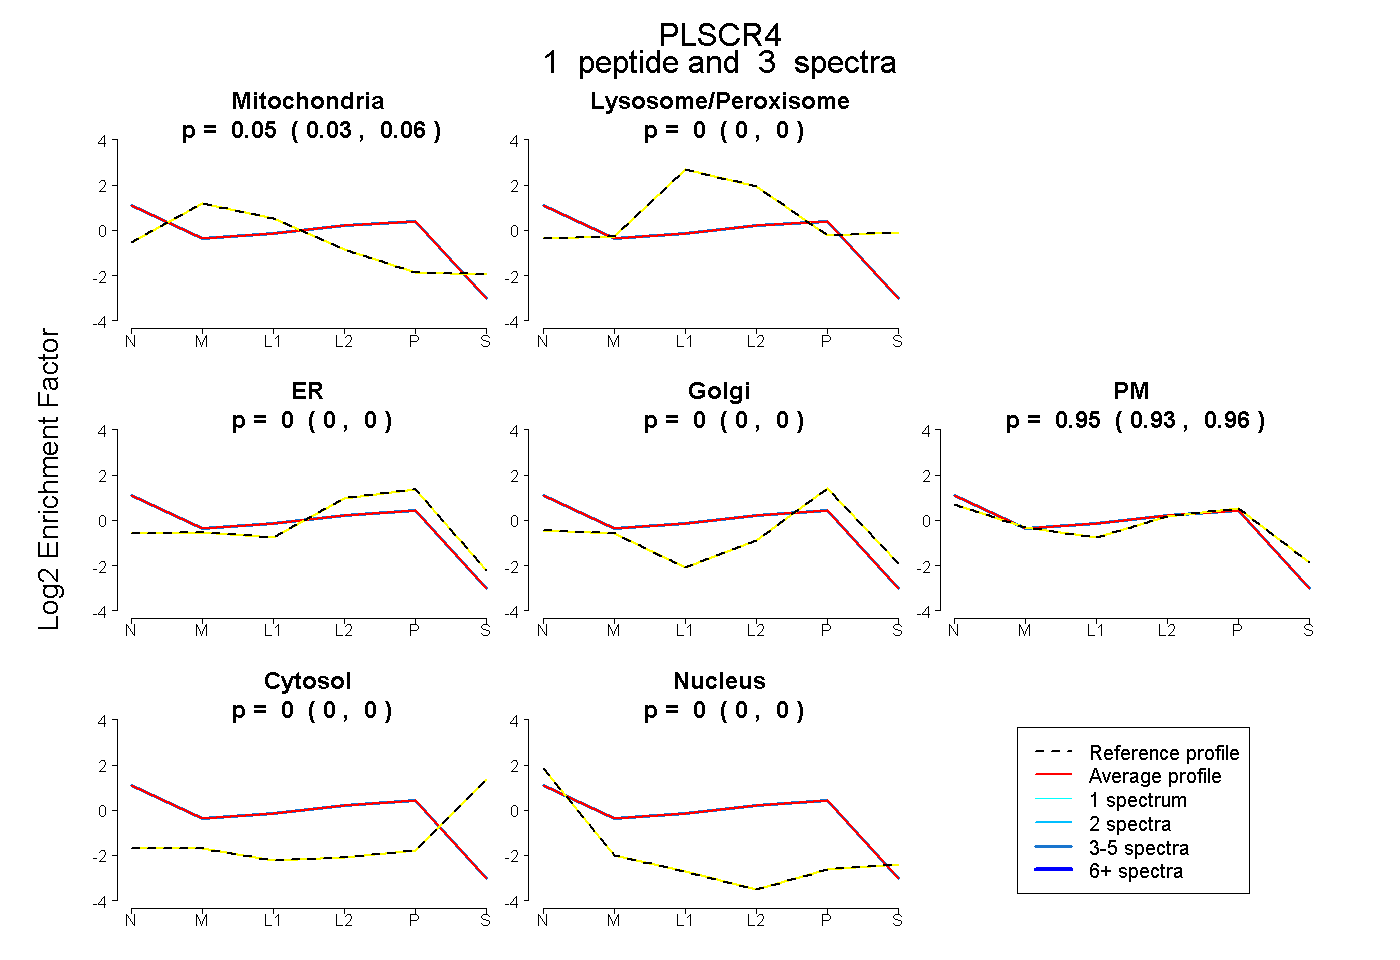
0.033 | 0.063
0.000 | 0.003
0.000 | 0.003
0.000 | 0.000
0.931 | 0.963
0.000 | 0.000
0.000 | 0.000
4peptides
spectra
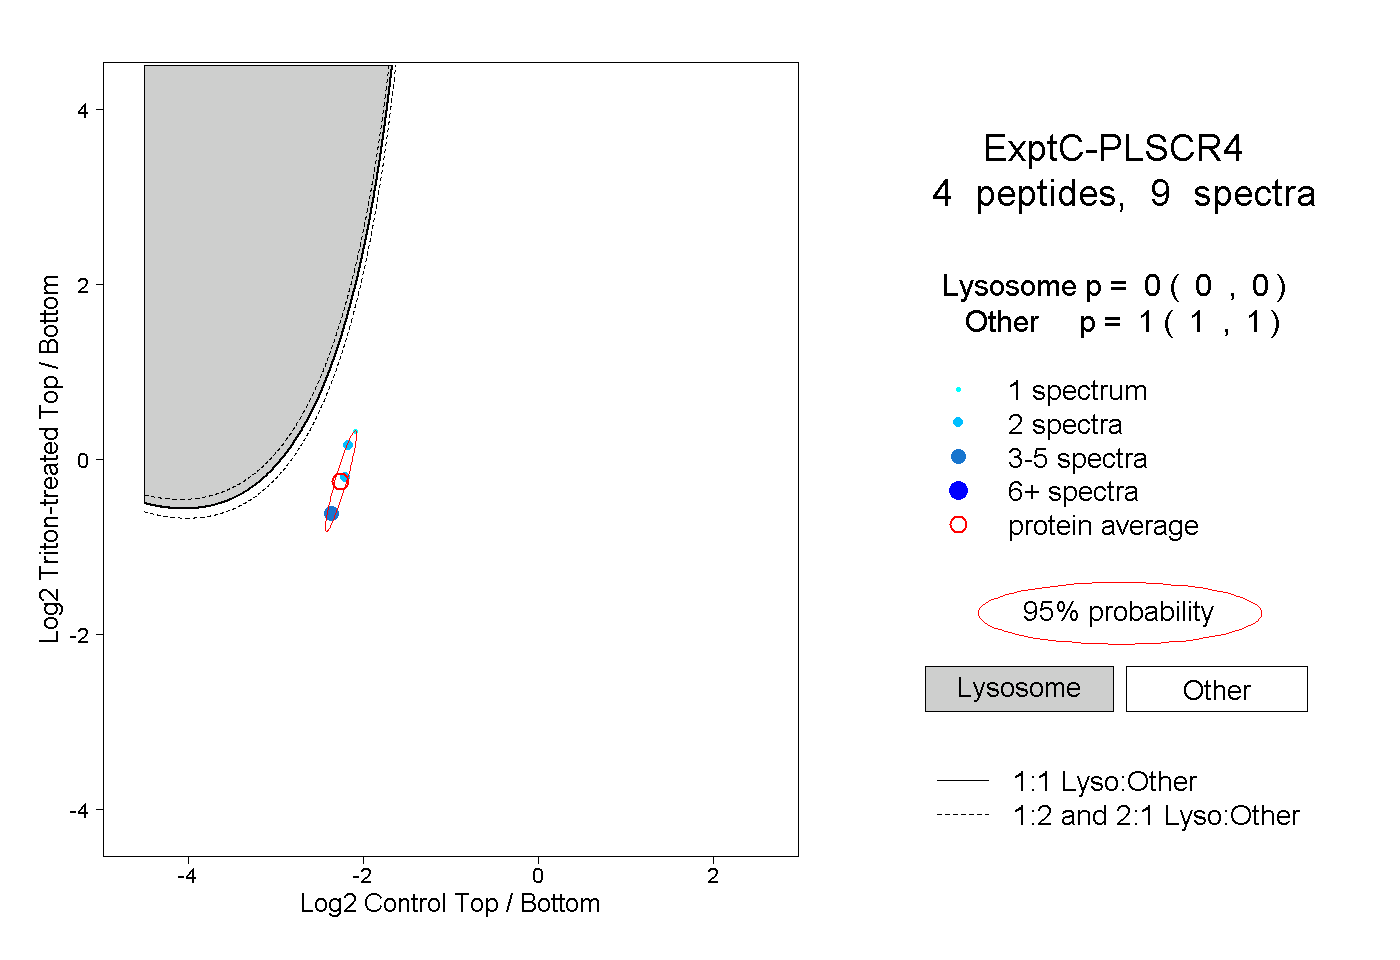
0.000 | 0.000
1.000 | 1.000
1peptide
spectrum
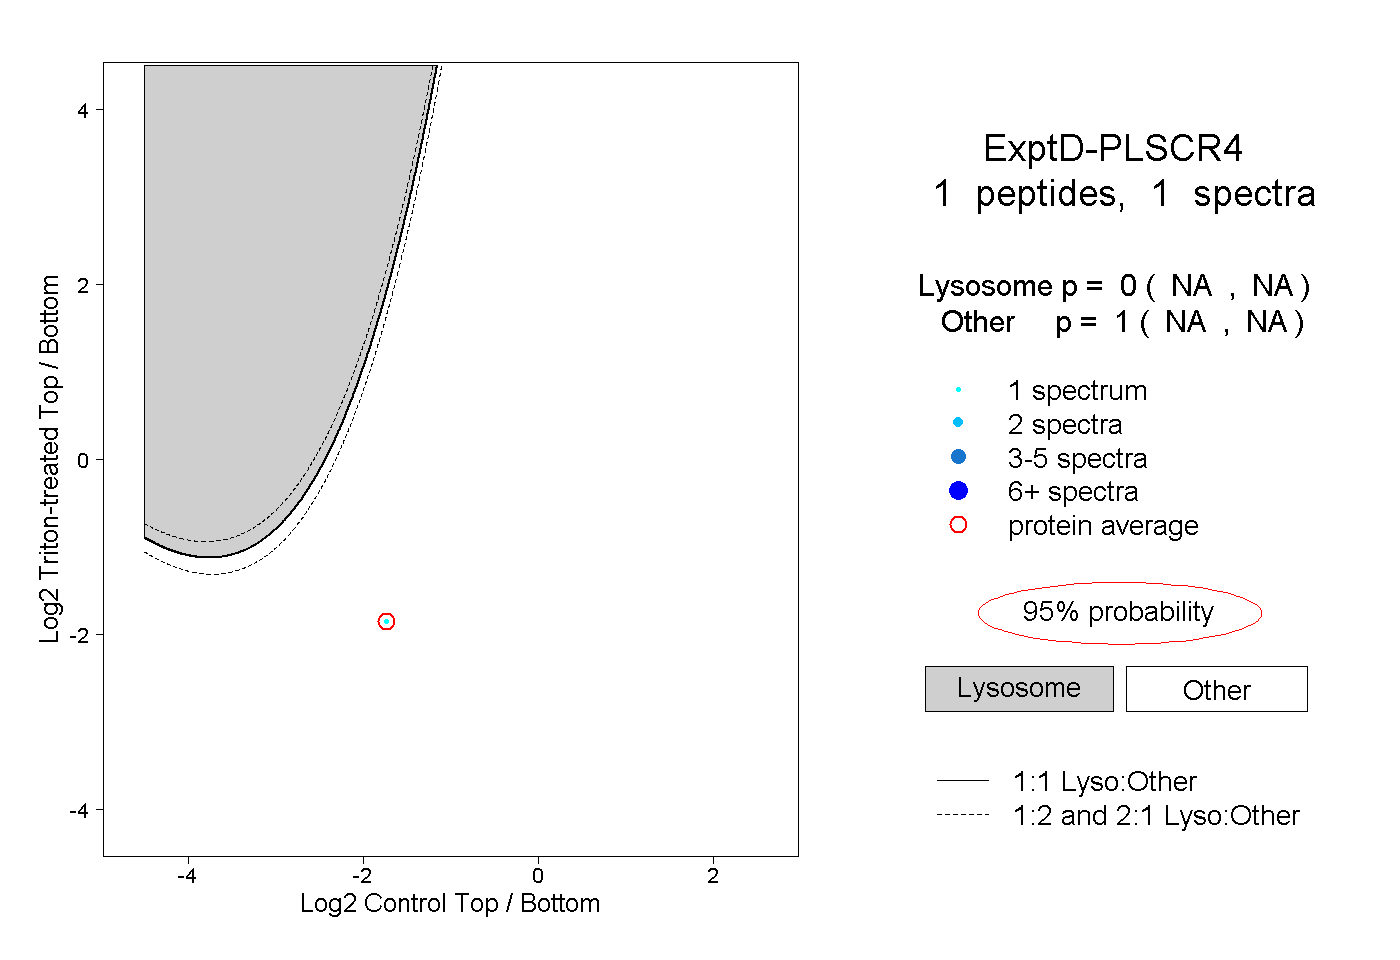
NA | NA
NA | NA