 4
4peptides
spectra
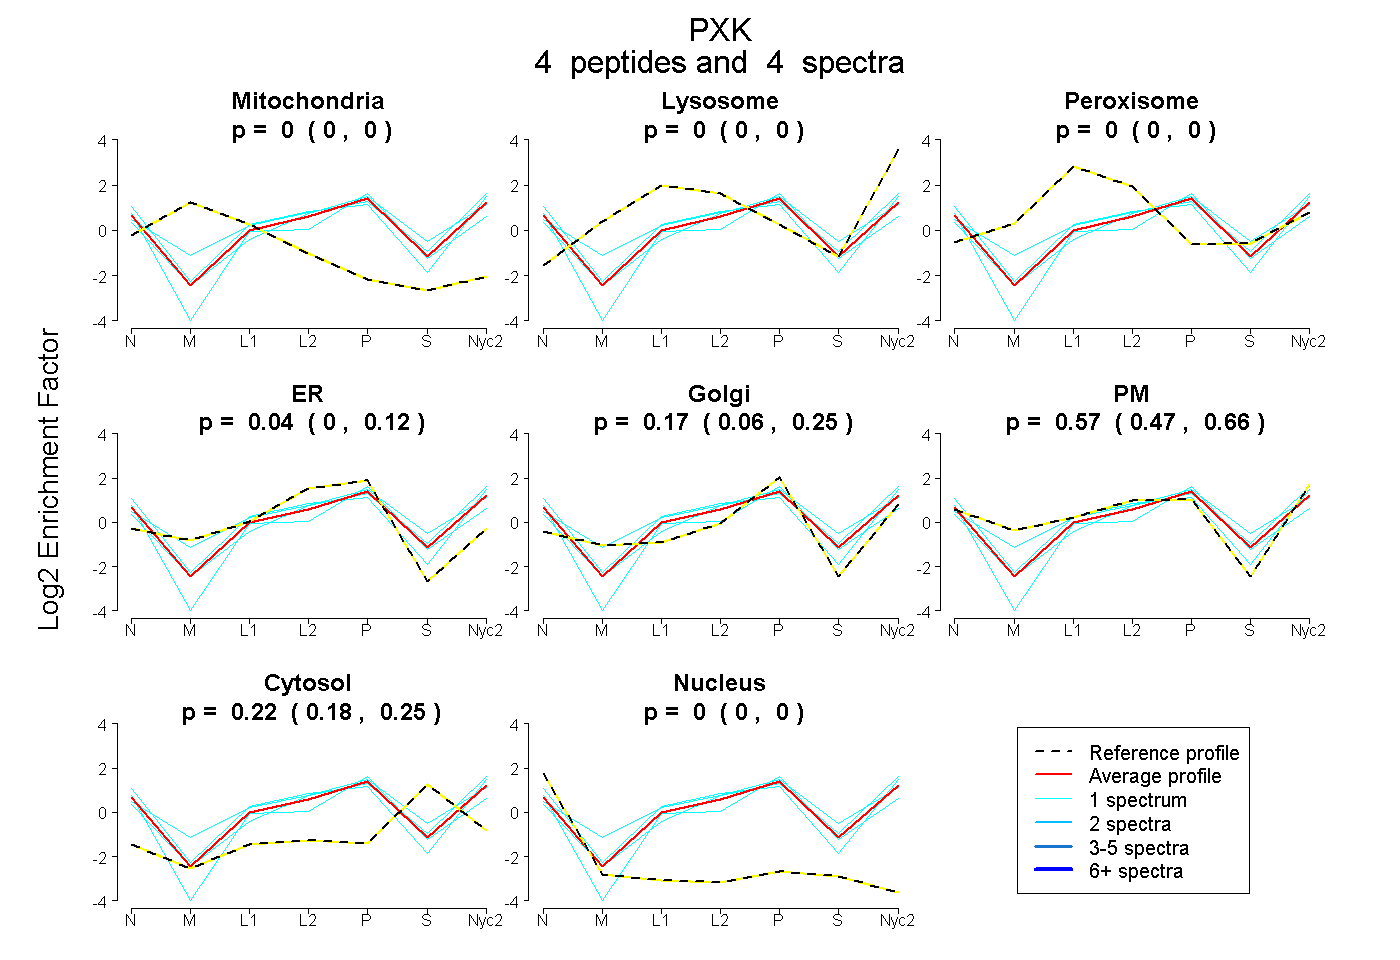
0.000 | 0.000
0.000 | 0.000
0.000 | 0.000
0.000 | 0.125
0.063 | 0.250
0.471 | 0.656
0.177 | 0.253
0.000 | 0.000
| Plot | Mito | Lyso | Perox | ER | Golgi | PM | Cytosol | Nucleus | |||||
| Expt A |
4 peptides |
4 spectra |
|
0.000 0.000 | 0.000 |
0.000 0.000 | 0.000 |
0.000 0.000 | 0.000 |
0.036 0.000 | 0.125 |
0.170 0.063 | 0.250 |
0.573 0.471 | 0.656 |
0.220 0.177 | 0.253 |
0.000 0.000 | 0.000 |
| 1 spectrum, LVLSWADLGPDK | 0.000 | 0.000 | 0.000 | 0.018 | 0.009 | 0.840 | 0.115 | 0.018 | ||
| 1 spectrum, VTFATASESSALLIR | 0.000 | 0.000 | 0.000 | 0.068 | 0.198 | 0.445 | 0.288 | 0.000 | ||
| 1 spectrum, YCNPK | 0.000 | 0.085 | 0.000 | 0.000 | 0.028 | 0.716 | 0.171 | 0.000 | ||
| 1 spectrum, SAVENSEEQPVK | 0.000 | 0.000 | 0.000 | 0.104 | 0.463 | 0.148 | 0.263 | 0.022 |
| Plot | Lyso | Other | |||||||||||
| Expt C |
7 peptides |
12 spectra |
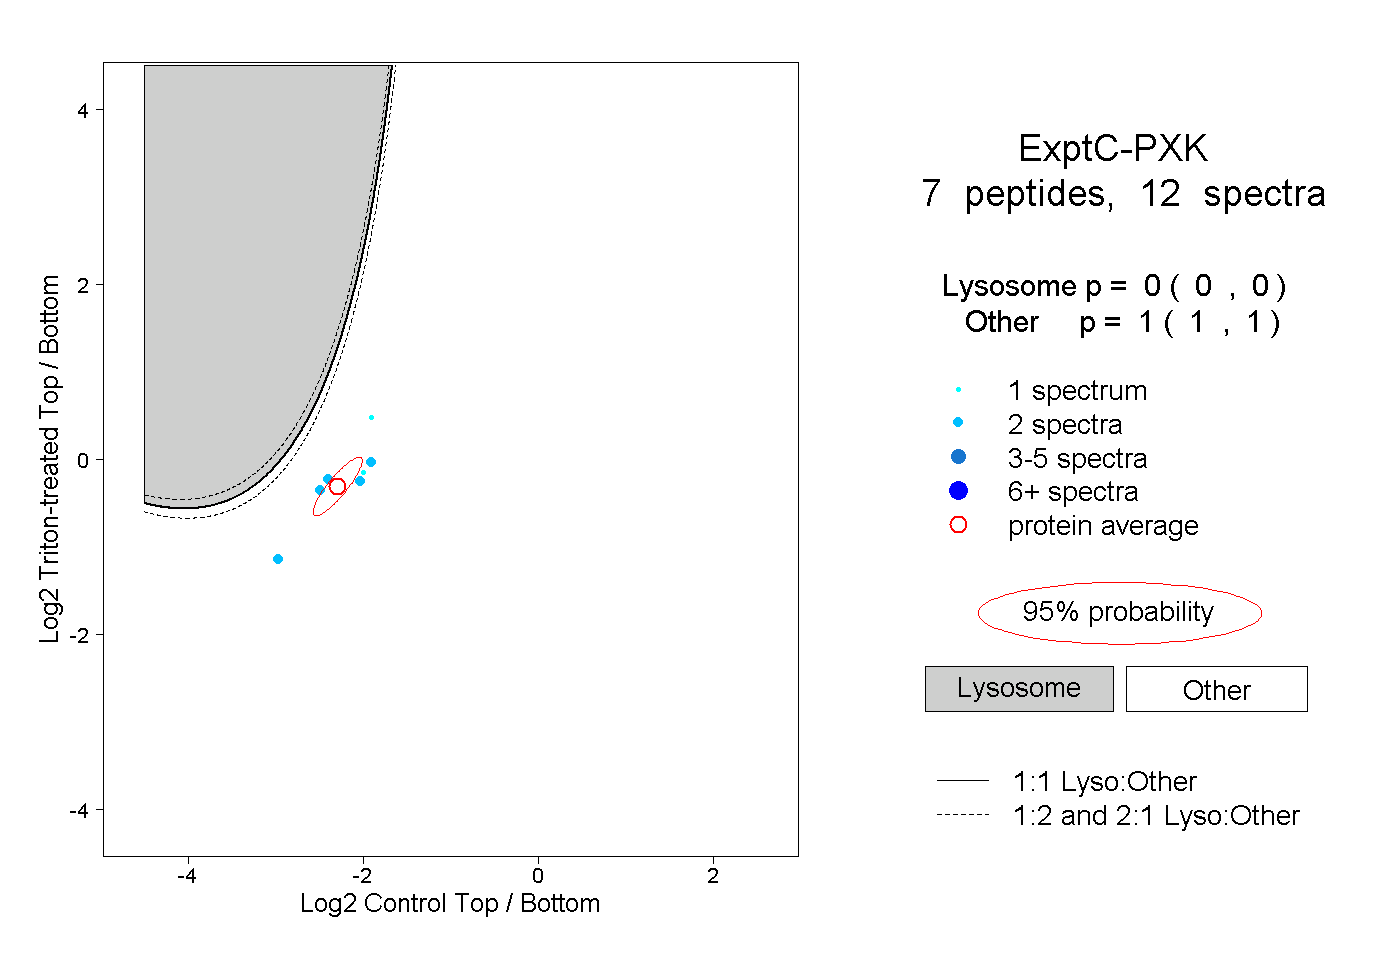 |
0.000 0.000 | 0.000 |
1.000 1.000 | 1.000 |