12
12peptides
spectra
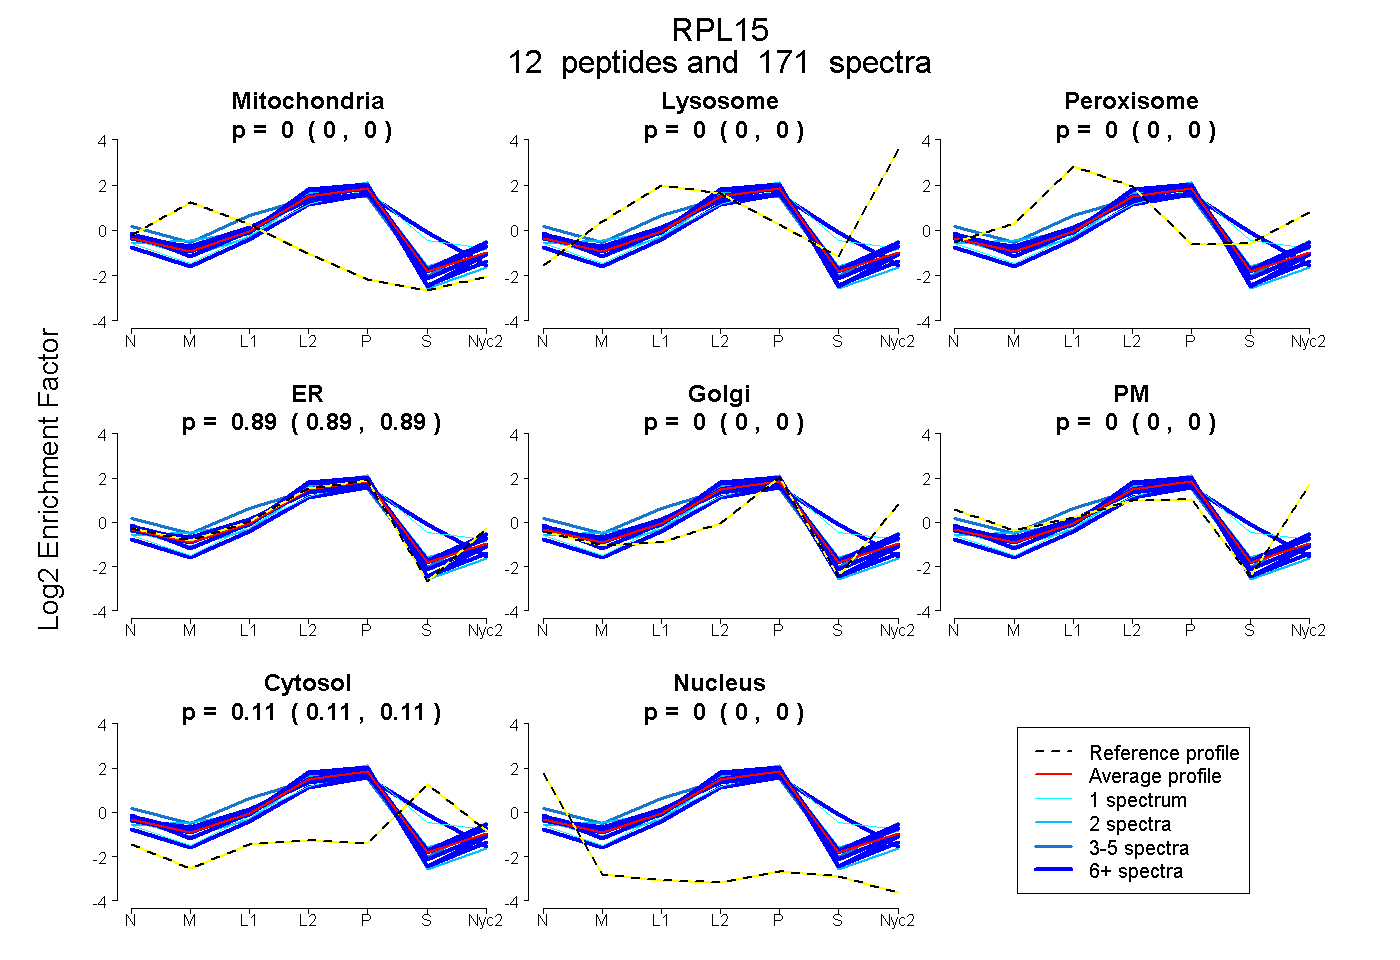
0.000 | 0.000
0.000 | 0.000
0.000 | 0.000
0.887 | 0.893
0.000 | 0.000
0.000 | 0.000
0.106 | 0.113
0.000 | 0.000
11peptides
spectra
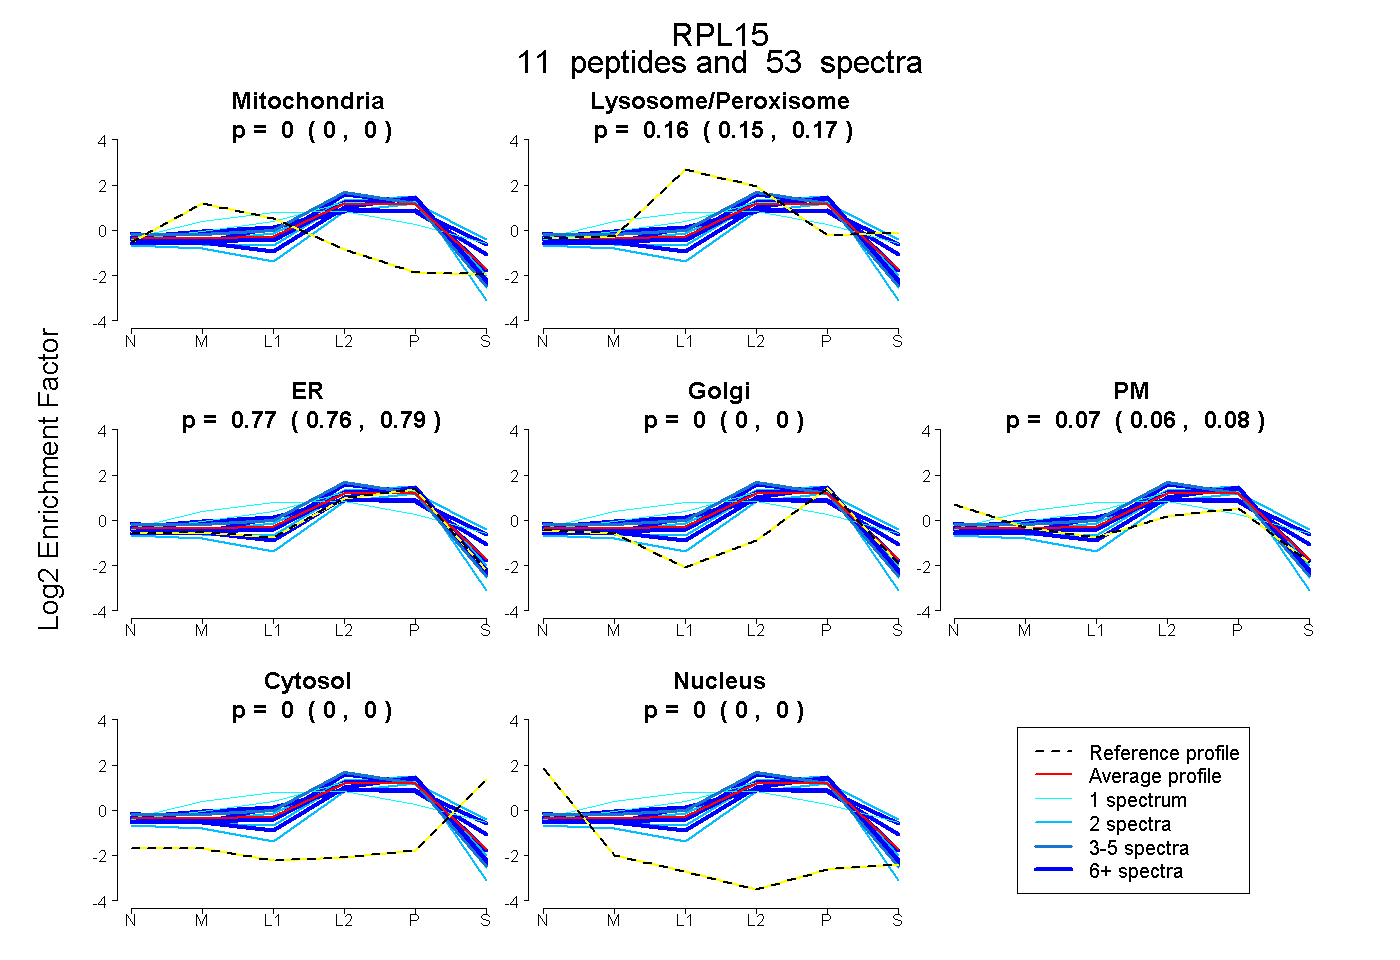
0.000 | 0.000
0.147 | 0.168
0.756 | 0.786
0.000 | 0.000
0.057 | 0.079
0.000 | 0.000
0.000 | 0.000
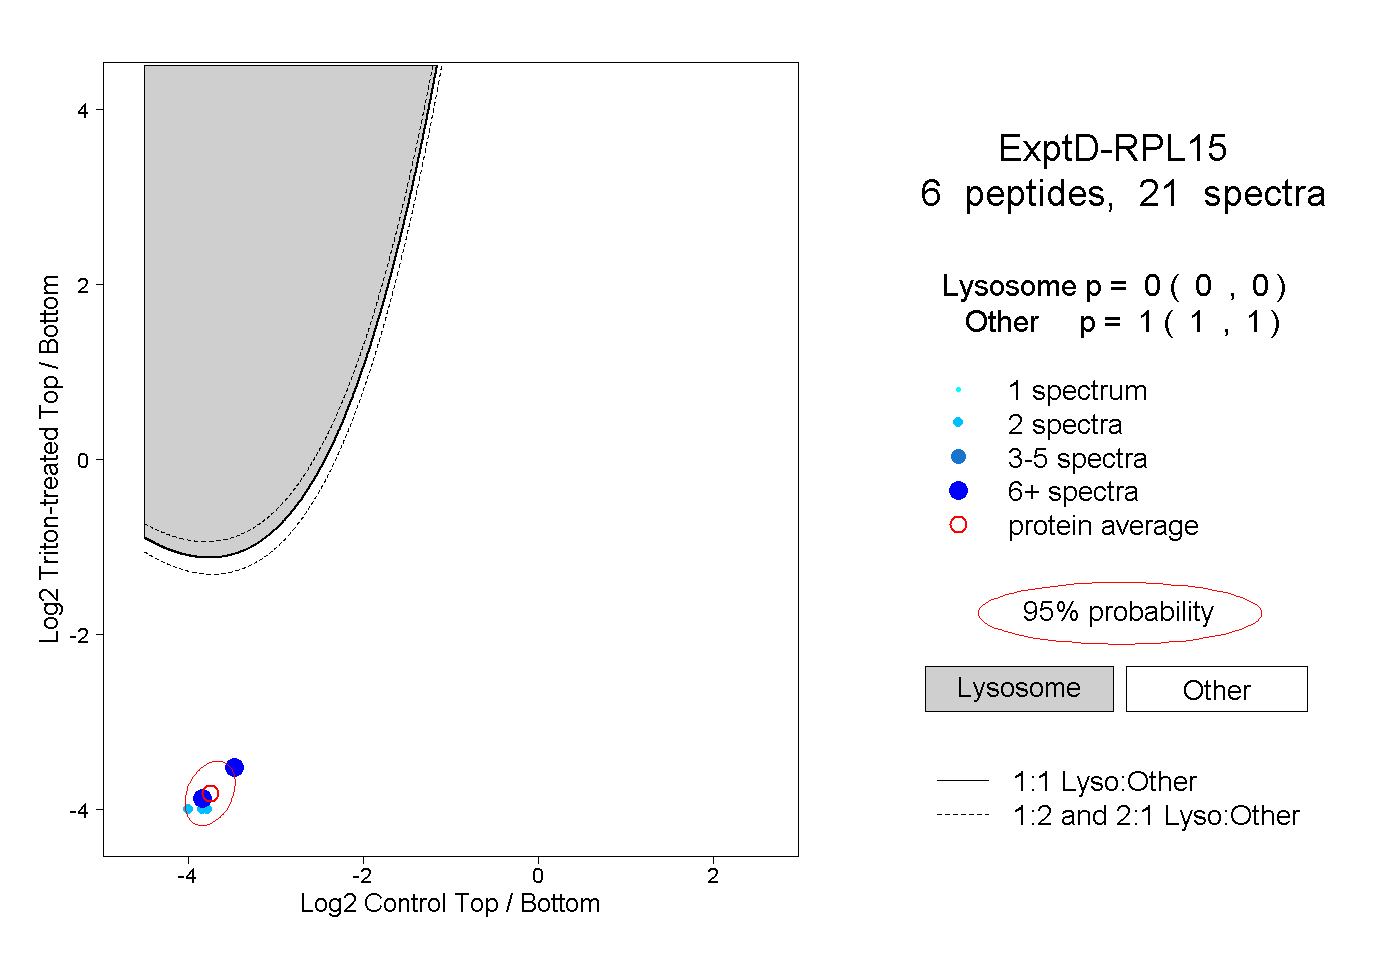
13peptides
spectra
0.000 | 0.000
1.000 | 1.000