 12
12peptides
spectra
0.000 | 0.000
0.000 | 0.000
0.000 | 0.000
0.887 | 0.893
0.000 | 0.000
0.000 | 0.000
0.106 | 0.113
0.000 | 0.000
| Plot | Mito | Lyso | Perox | ER | Golgi | PM | Cytosol | Nucleus | |||||
| Expt A |
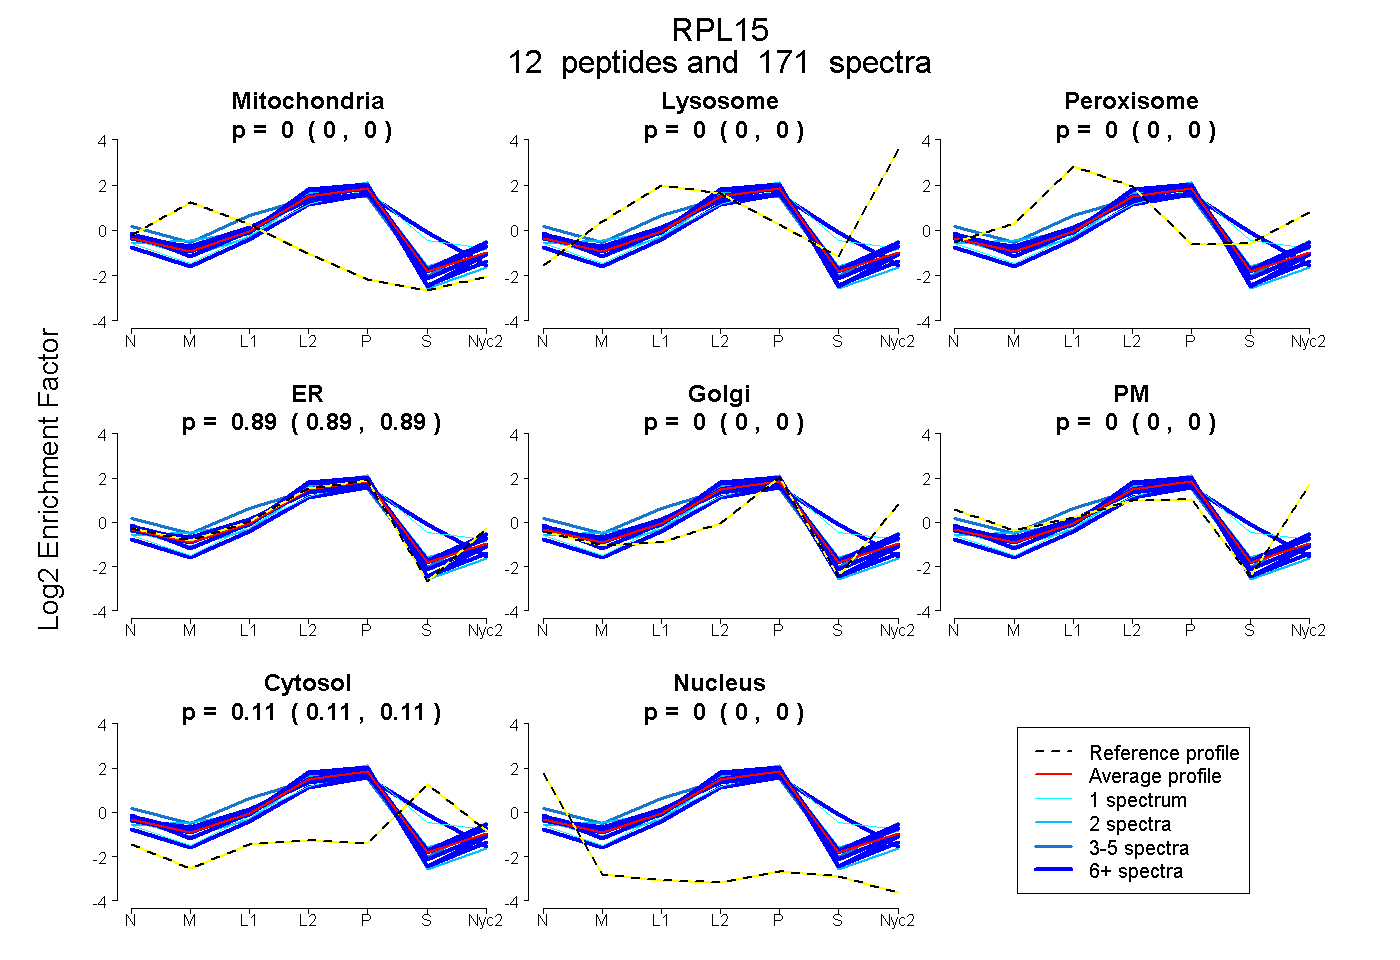
12 peptides |
171 spectra |
|
0.000 0.000 | 0.000 |
0.000 0.000 | 0.000 |
0.000 0.000 | 0.000 |
0.890 0.887 | 0.893 |
0.000 0.000 | 0.000 |
0.000 0.000 | 0.000 |
0.110 0.106 | 0.113 |
0.000 0.000 | 0.000 |
| 1 spectrum, NPDTQWITKPVHK | 0.000 | 0.000 | 0.002 | 0.699 | 0.000 | 0.000 | 0.298 | 0.000 | ||
| 39 spectra, NTLQLHR | 0.000 | 0.000 | 0.051 | 0.870 | 0.000 | 0.000 | 0.079 | 0.000 | ||
| 12 spectra, YIQELWR | 0.000 | 0.000 | 0.000 | 0.984 | 0.000 | 0.000 | 0.000 | 0.016 | ||
| 3 spectra, FHHTIGGSR | 0.000 | 0.000 | 0.196 | 0.768 | 0.000 | 0.000 | 0.000 | 0.037 | ||
| 2 spectra, HCGAWR | 0.000 | 0.000 | 0.059 | 0.850 | 0.000 | 0.000 | 0.091 | 0.000 | ||
| 2 spectra, APRPTRPDK | 0.000 | 0.000 | 0.000 | 0.929 | 0.000 | 0.000 | 0.000 | 0.071 | ||
| 9 spectra, QGYVIYR | 0.008 | 0.000 | 0.000 | 0.928 | 0.000 | 0.000 | 0.048 | 0.016 | ||
| 13 spectra, QSDVMR | 0.000 | 0.000 | 0.000 | 0.931 | 0.000 | 0.000 | 0.000 | 0.069 | ||
| 28 spectra, SLQSVAEER | 0.000 | 0.000 | 0.005 | 0.892 | 0.000 | 0.000 | 0.103 | 0.000 | ||
| 19 spectra, QLSALHR | 0.000 | 0.000 | 0.073 | 0.821 | 0.000 | 0.000 | 0.106 | 0.000 | ||
| 20 spectra, FFEVILIDPFHK | 0.000 | 0.000 | 0.000 | 0.945 | 0.000 | 0.000 | 0.055 | 0.000 | ||
| 23 spectra, GLTSAGR | 0.000 | 0.000 | 0.000 | 0.621 | 0.000 | 0.000 | 0.379 | 0.000 |
| Plot | Mito | Lyso or Perox | ER | Golgi | PM | Cytosol | Nucleus | ||||||
| Expt B |
11 peptides |
53 spectra |
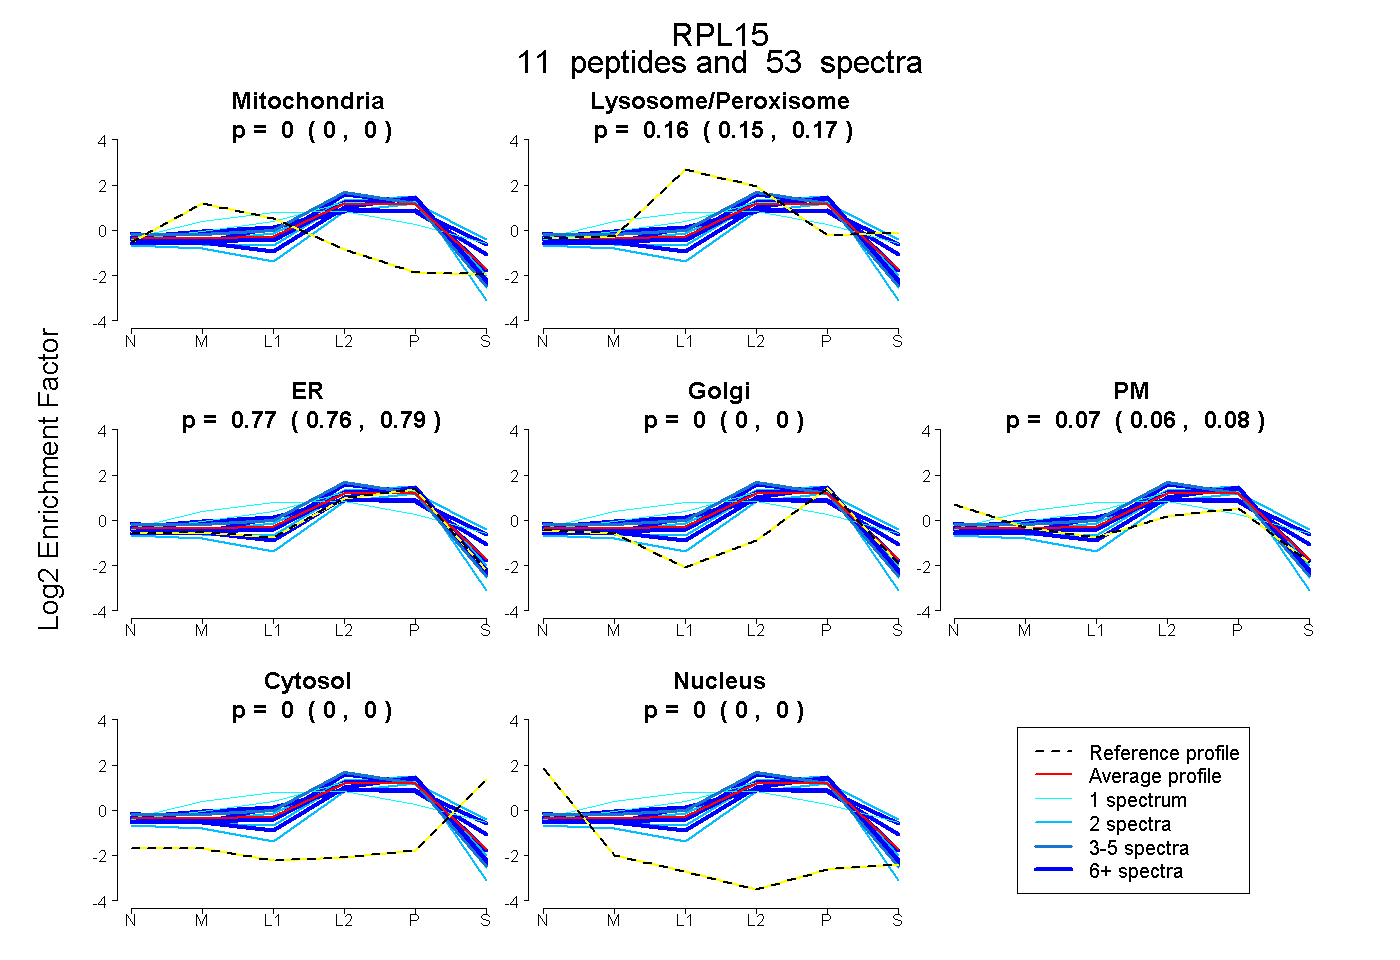 |
0.000 0.000 | 0.000 |
0.158 0.147 | 0.168 |
0.773 0.756 | 0.786 |
0.000 0.000 | 0.000 |
0.069 0.057 | 0.079 |
0.000 0.000 | 0.000 |
0.000 0.000 | 0.000 |
|||
| Plot | Lyso | Other | |||||||||||
| Expt C |
13 peptides |
180 spectra |
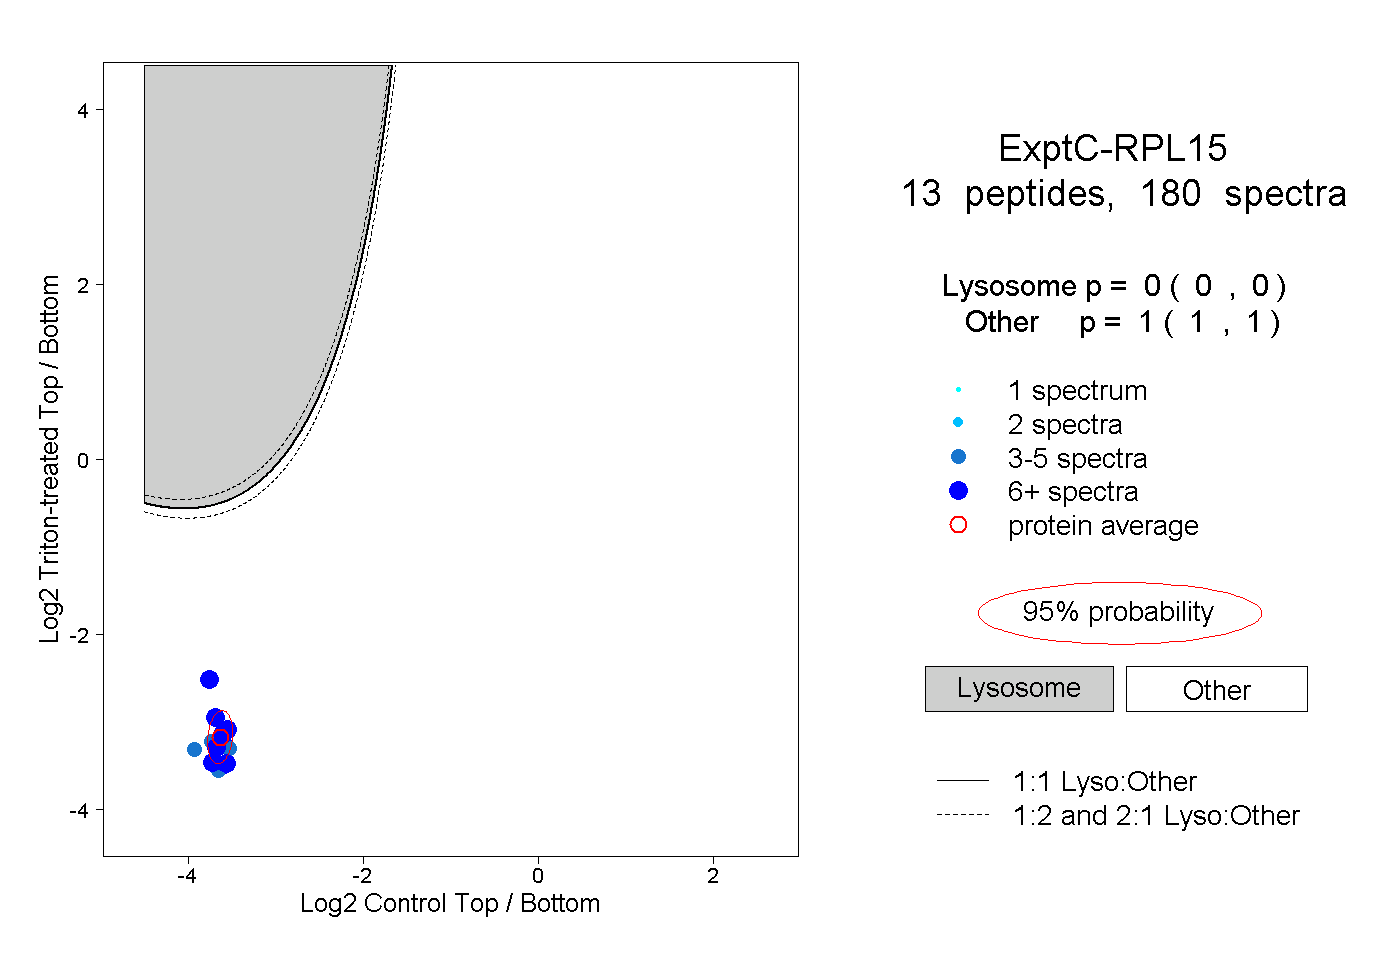 |
0.000 0.000 | 0.000 |
1.000 1.000 | 1.000 |
||||||||
| Plot | Lyso | Other | |||||||||||
| Expt D |
6 peptides |
21 spectra |
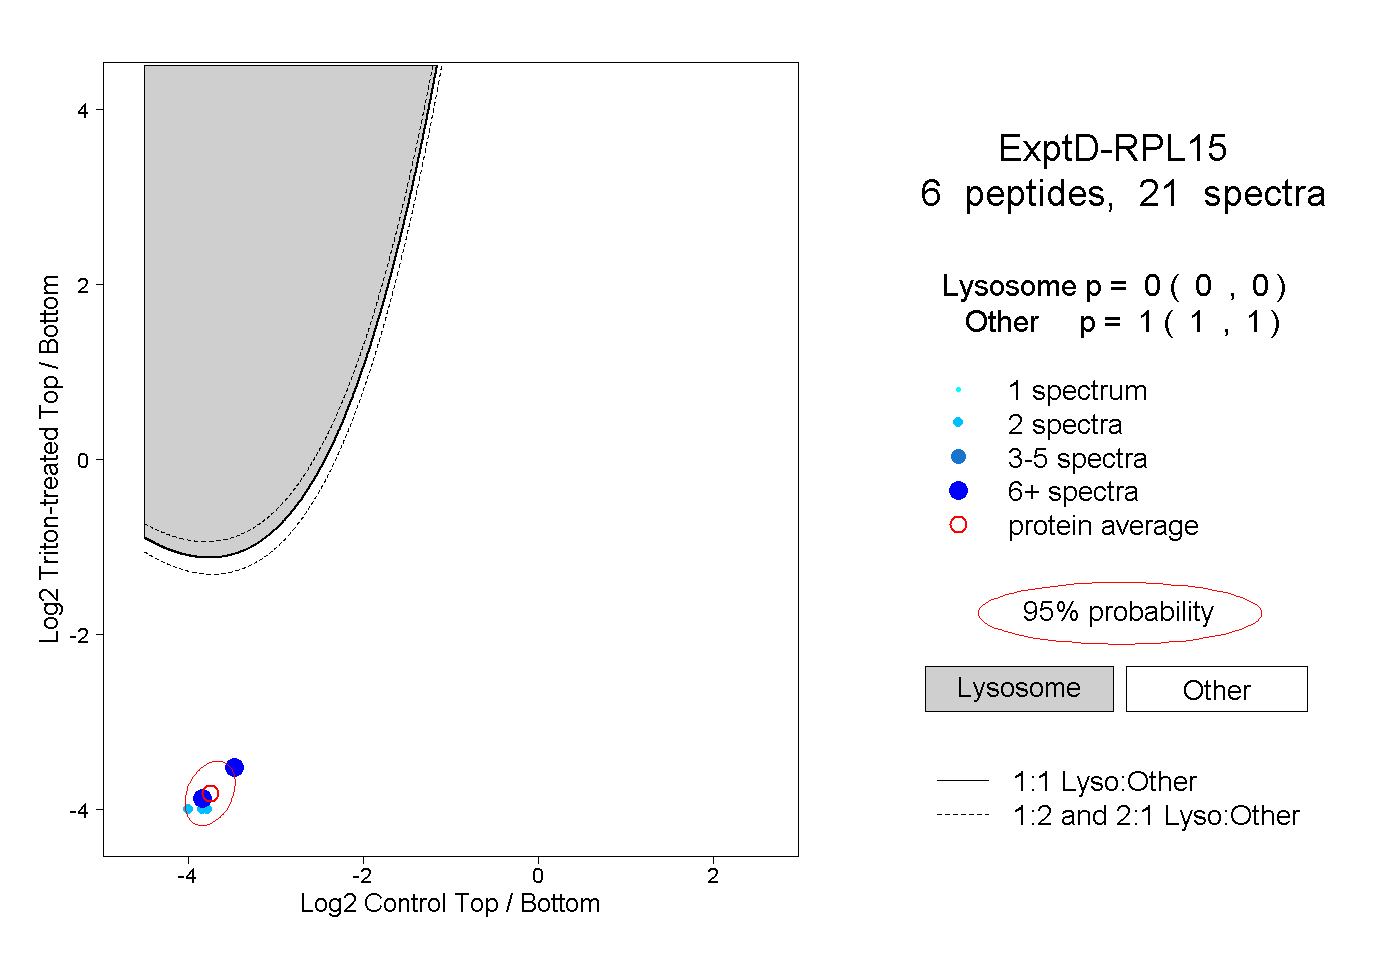 |
0.000 0.000 | 0.000 |
1.000 1.000 | 1.000 |