 44
44peptides
spectra
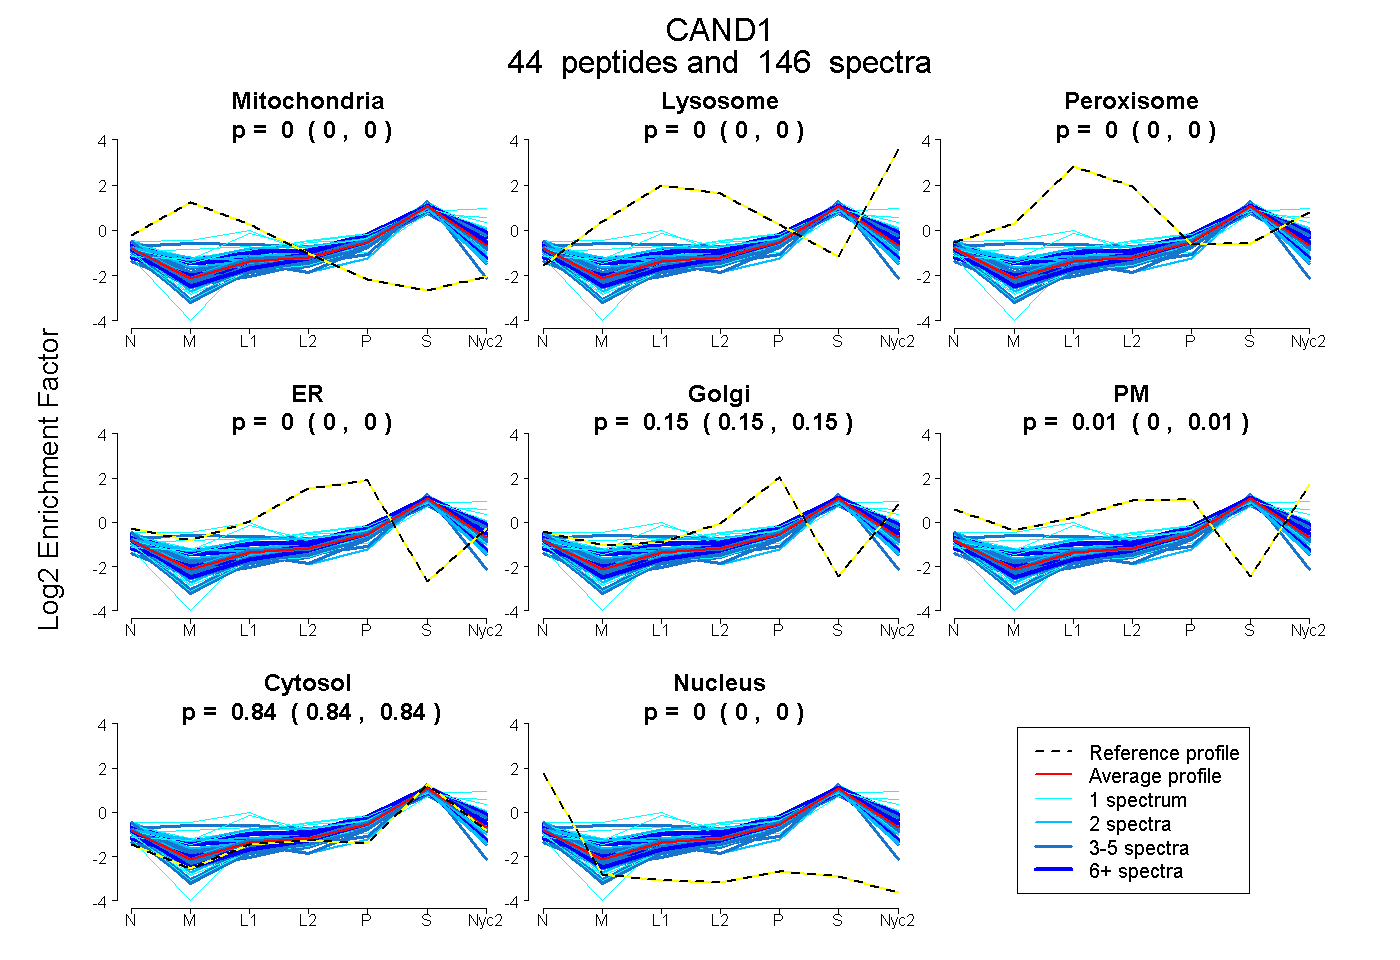
0.000 | 0.000
0.000 | 0.000
0.000 | 0.000
0.000 | 0.000
0.147 | 0.154
0.004 | 0.011
0.840 | 0.842
0.000 | 0.001
15peptides
spectra
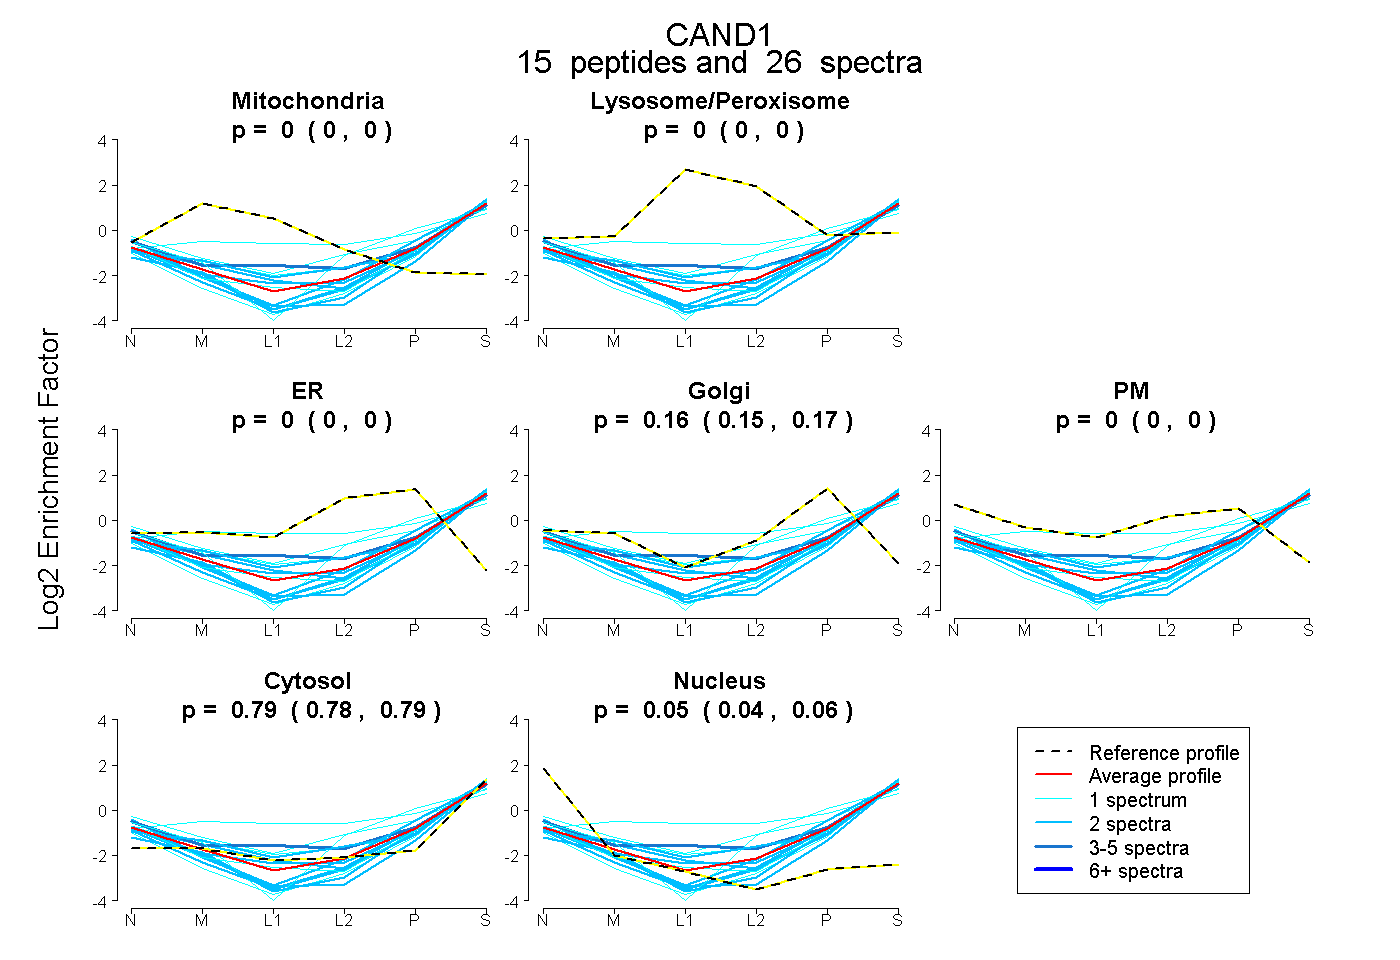
0.000 | 0.000
0.000 | 0.000
0.000 | 0.000
0.148 | 0.167
0.000 | 0.000
0.783 | 0.792
0.044 | 0.060
37peptides
spectra
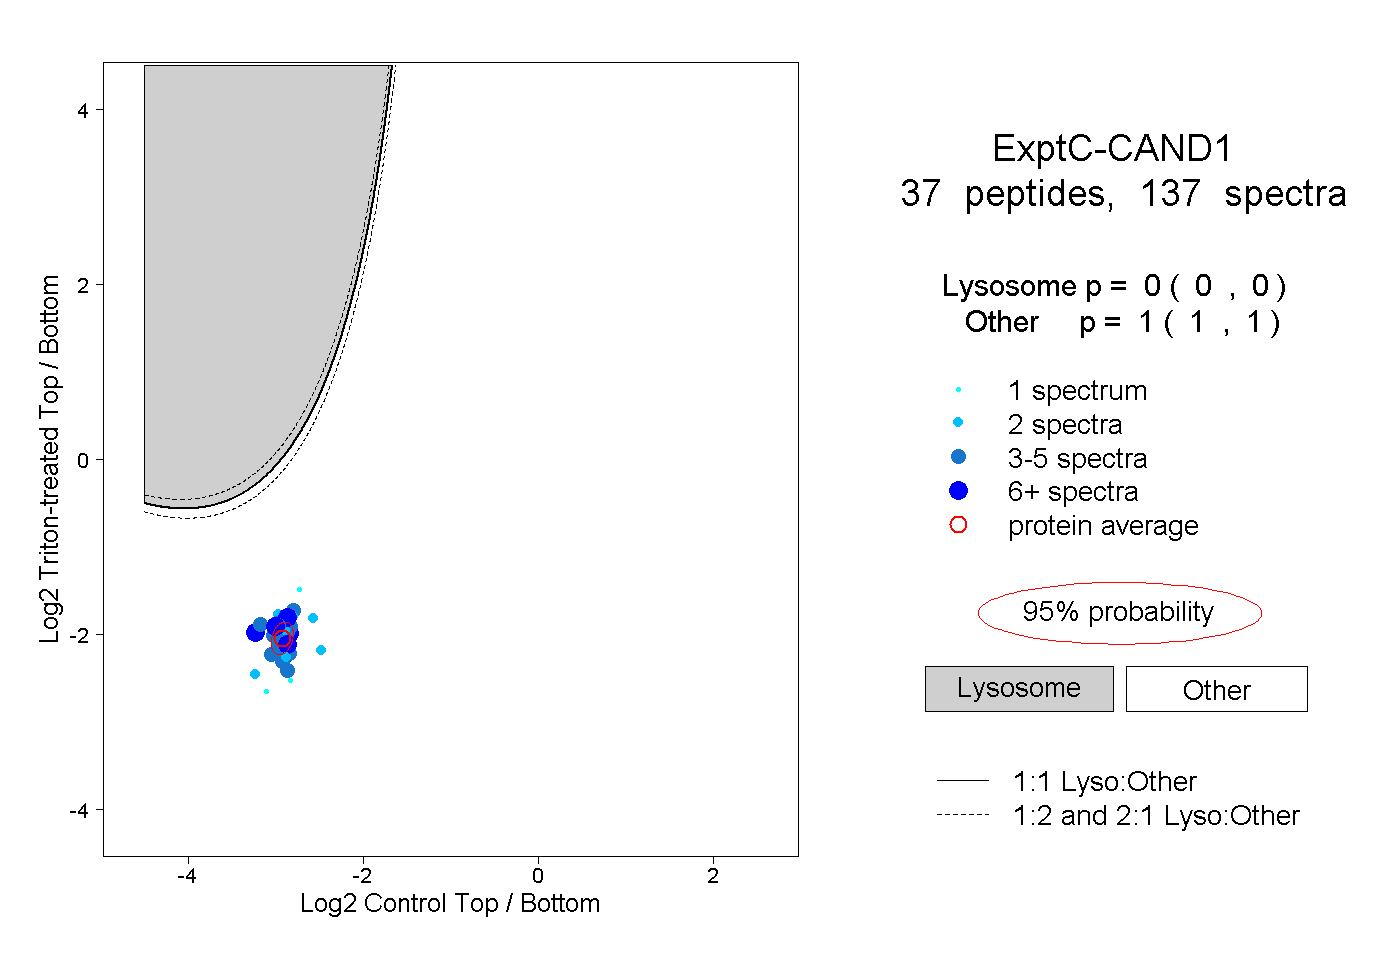
0.000 | 0.000
1.000 | 1.000
14peptides
spectra
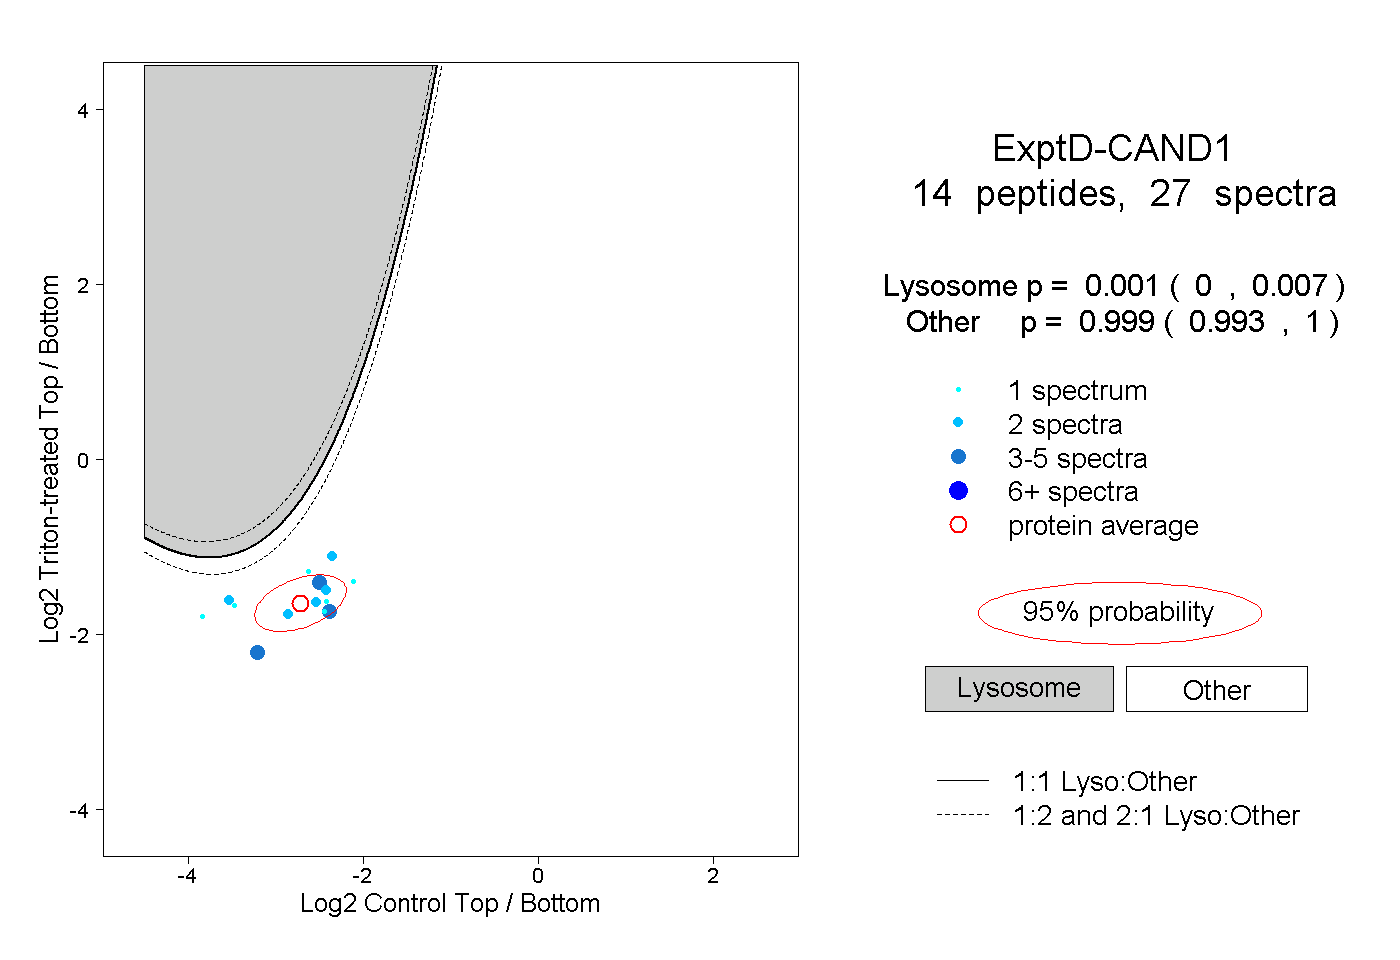
0.000 | 0.007
0.993 | 1.000