7
7peptides
spectra
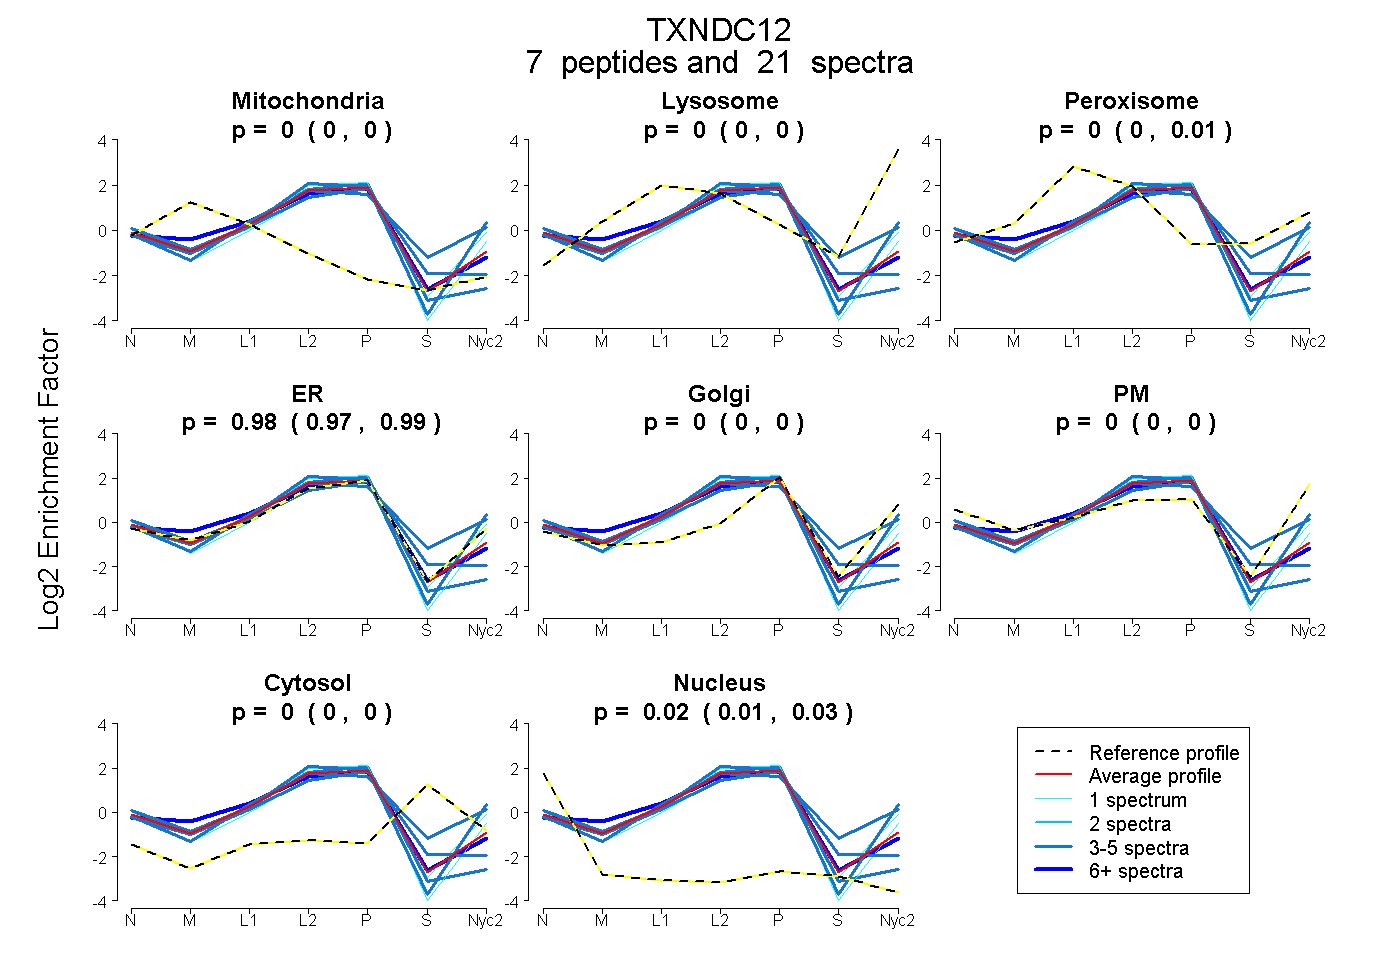
0.000 | 0.000
0.000 | 0.000
0.000 | 0.007
0.969 | 0.988
0.000 | 0.000
0.000 | 0.000
0.000 | 0.000
0.010 | 0.028
4peptides
spectra
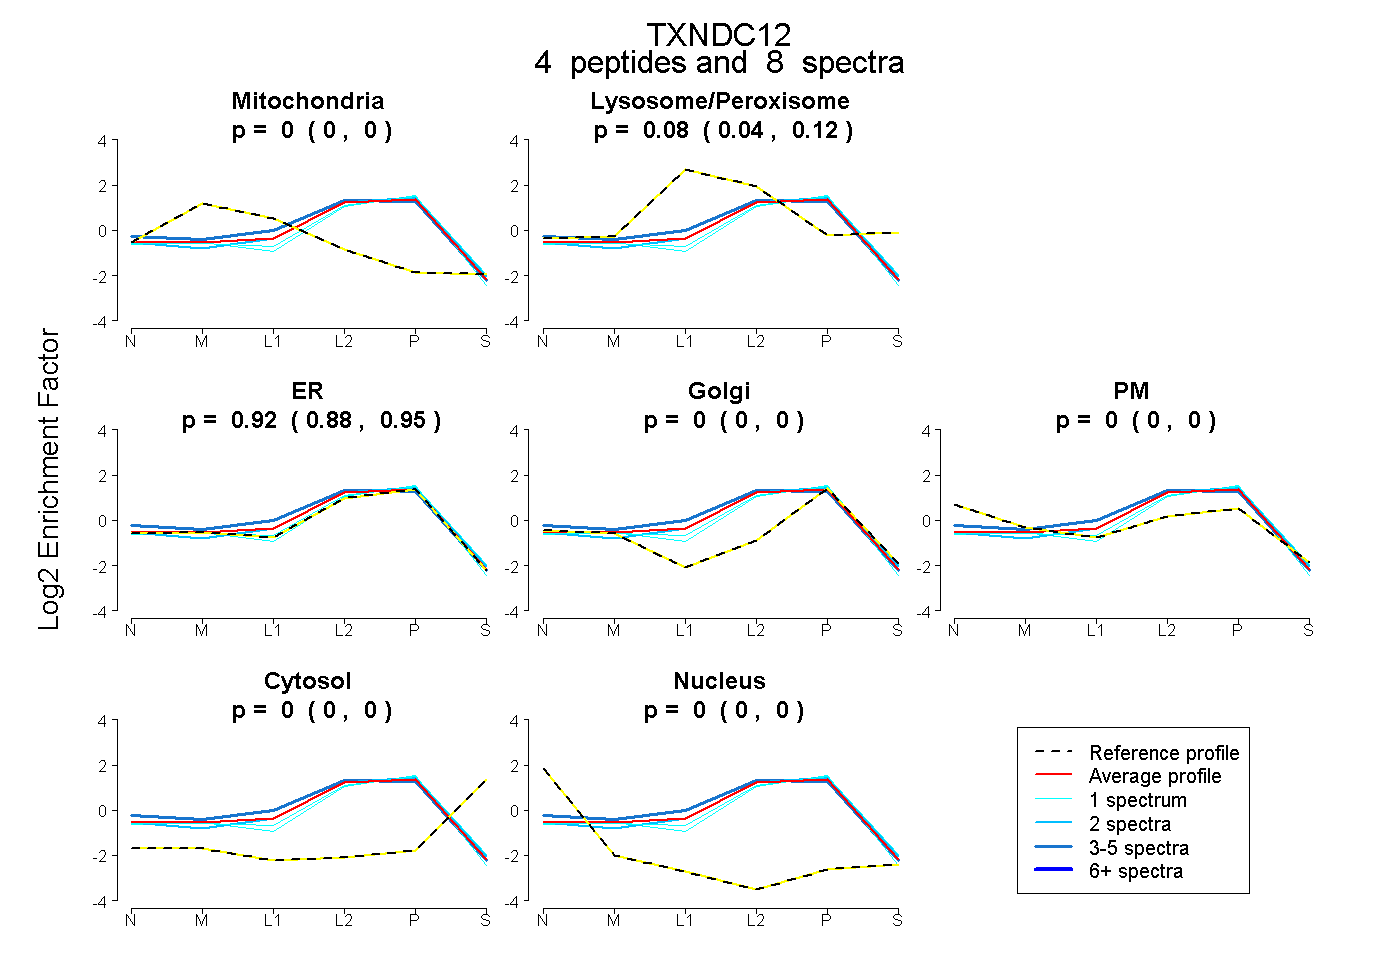
0.000 | 0.000
0.044 | 0.116
0.876 | 0.948
0.000 | 0.000
0.000 | 0.000
0.000 | 0.000
0.000 | 0.000
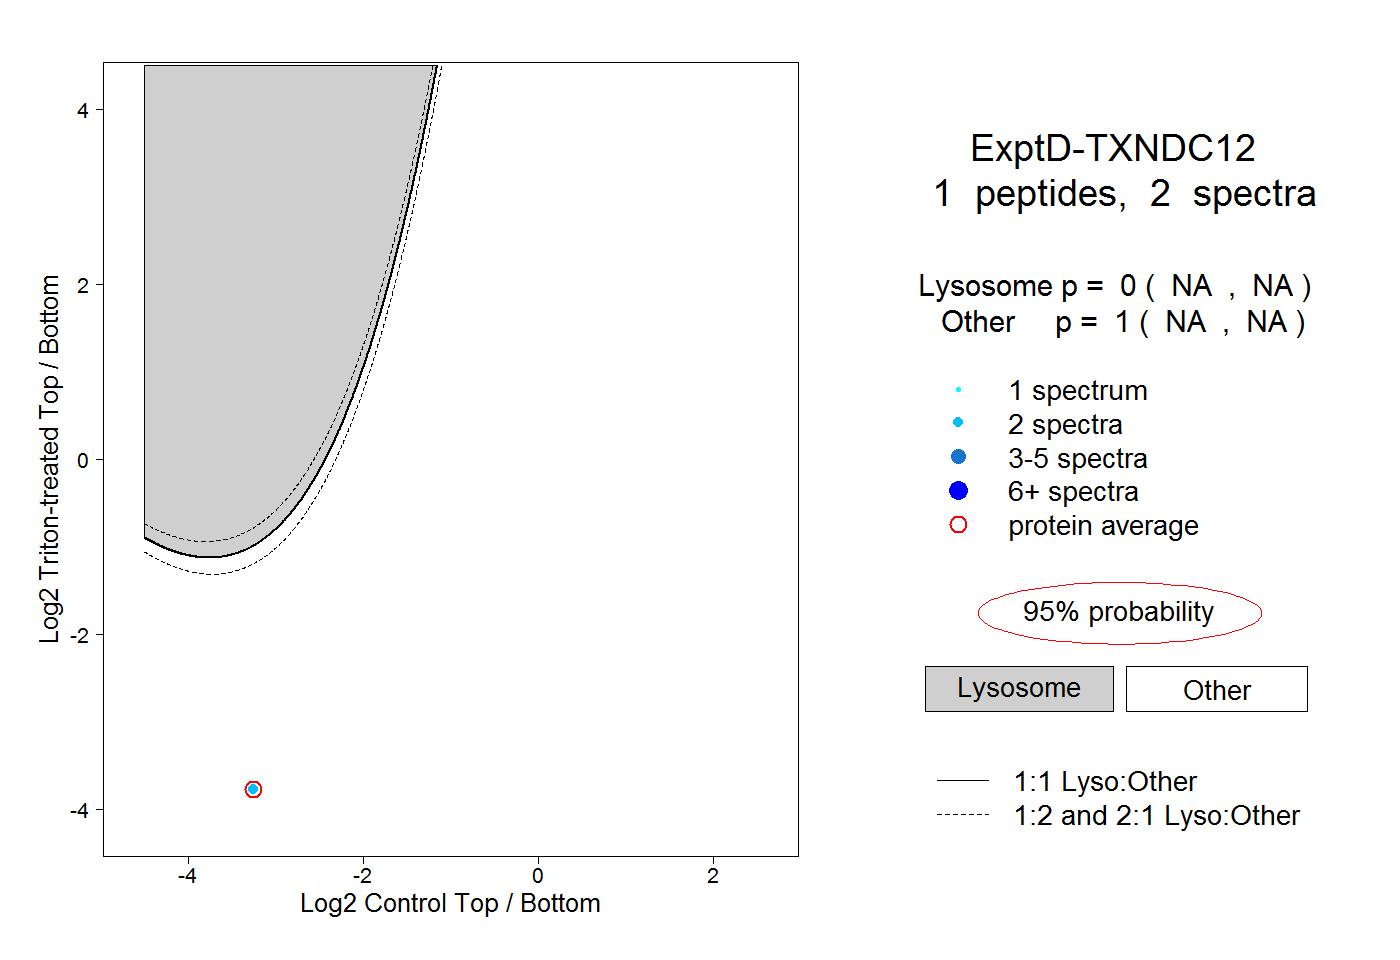
8peptides
spectra
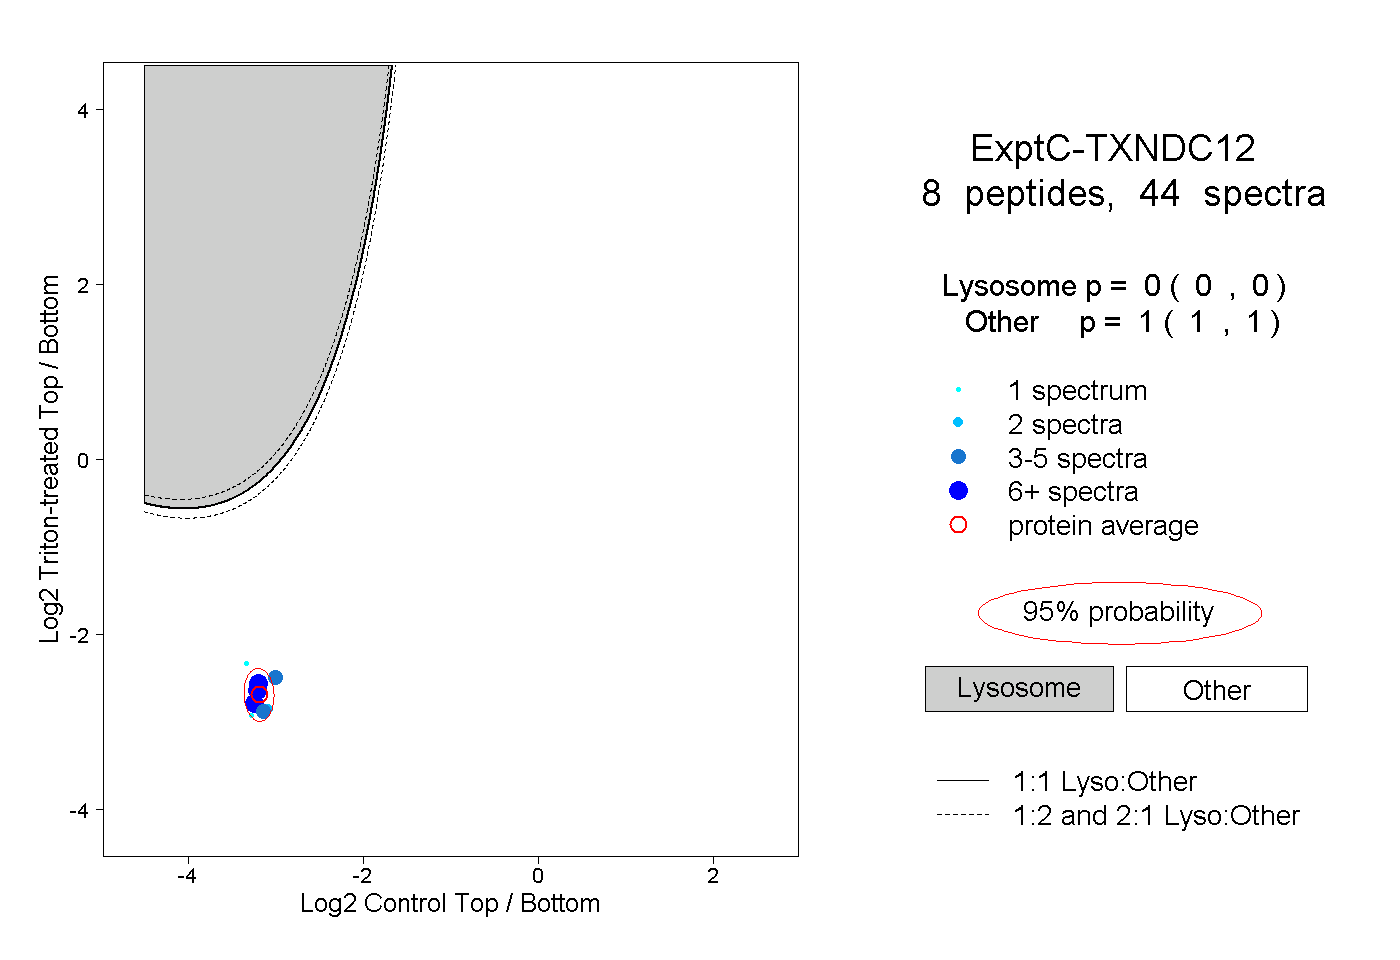
0.000 | 0.000
1.000 | 1.000