TXNDC12
[ENSRNOP00000010700]
Main page
| | | Plot |
Mito |
Lyso |
|
Perox |
ER |
Golgi |
PM |
Cytosol |
Nucleus |
|
| Expt A |
 7
7
peptides |
21
spectra |
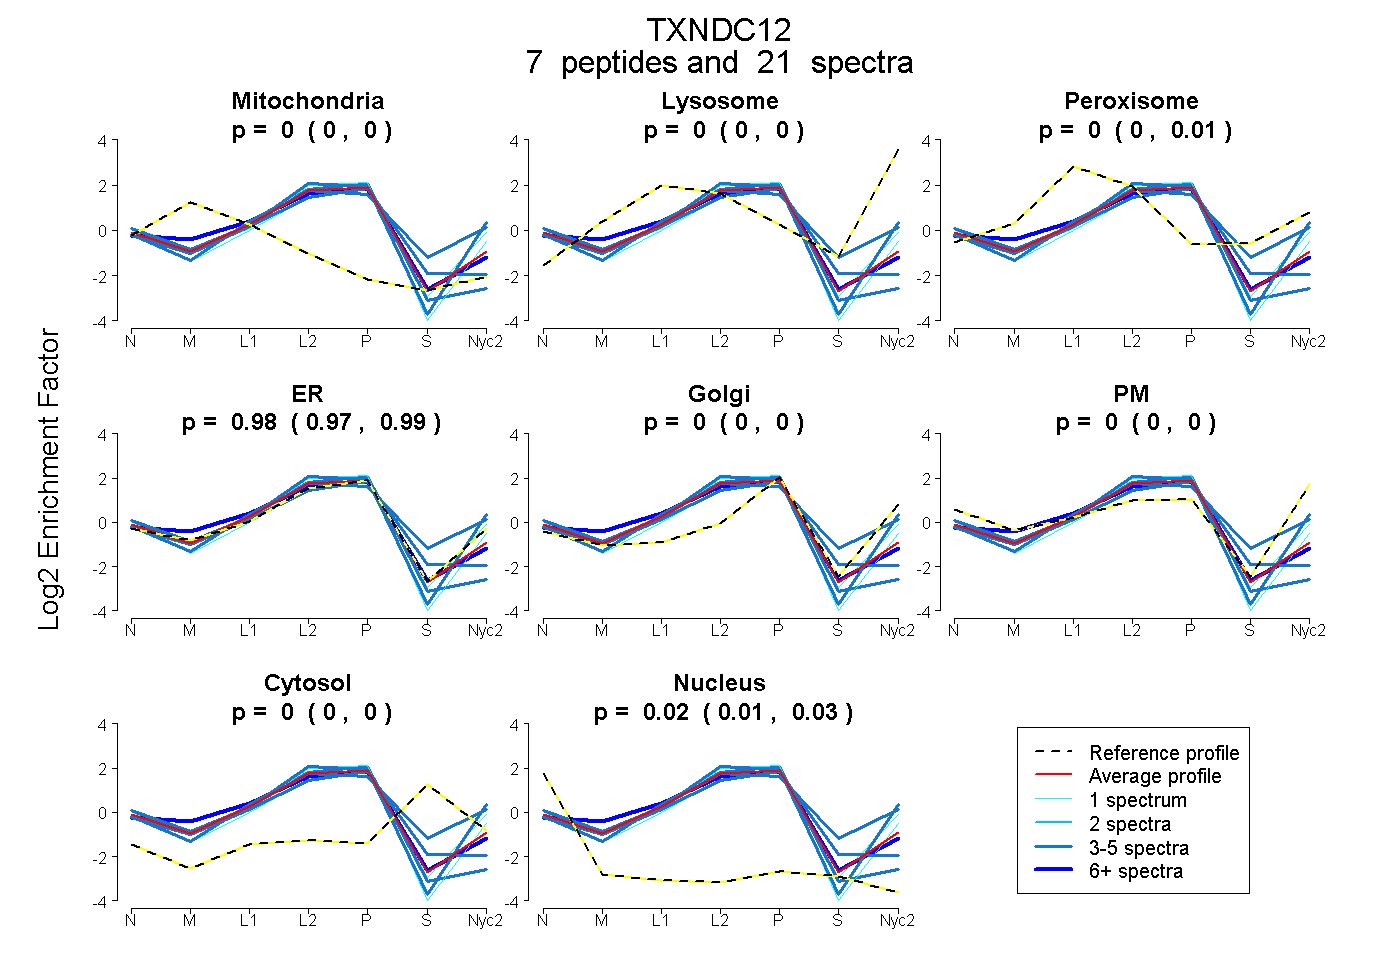 |
0.000
0.000 | 0.000 |
0.000
0.000 | 0.000 |
|
0.000
0.000 | 0.007 |
0.981
0.969 | 0.988 |
0.000
0.000 | 0.000 |
0.000
0.000 | 0.000 |
0.000
0.000 | 0.000 |
0.019
0.010 | 0.028 |
|
| | | Plot |
Mito |
|
Lyso or Perox |
|
ER |
Golgi |
PM |
Cytosol |
Nucleus |
|
| Expt B |
4
peptides |
8
spectra |
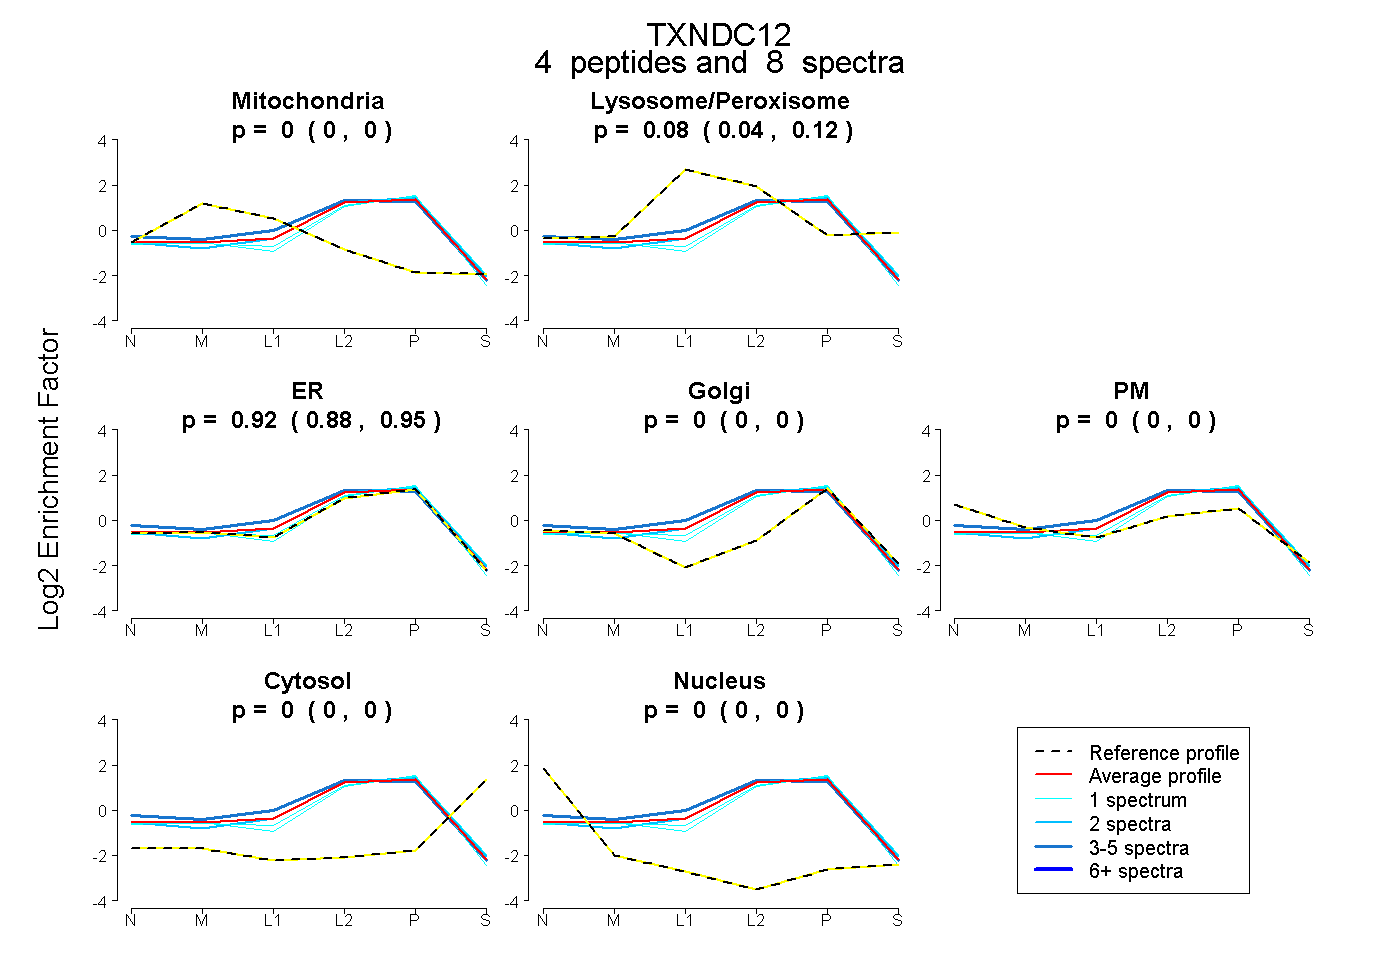 |
0.000
0.000 | 0.000 |
|
0.084
0.044 | 0.116 |
|
0.916
0.876 | 0.948 |
0.000
0.000 | 0.000 |
0.000
0.000 | 0.000 |
0.000
0.000 | 0.000 |
0.000
0.000 | 0.000 |
|
| 1 spectrum, LTGDAFR |
0.000 |
|
0.032 |
|
0.968 |
0.000 |
0.000 |
0.000 |
0.000 |
|
| 2 spectra, ILFLDPSGK |
0.000 |
|
0.089 |
|
0.911 |
0.000 |
0.000 |
0.000 |
0.000 |
|
| 1 spectrum, HFQDEL |
0.000 |
|
0.000 |
|
0.991 |
0.009 |
0.000 |
0.000 |
0.000 |
|
| 4 spectra, GFGDHIHWR |
0.000 |
|
0.158 |
|
0.838 |
0.000 |
0.004 |
0.000 |
0.000 |
|
| | | Plot |
|
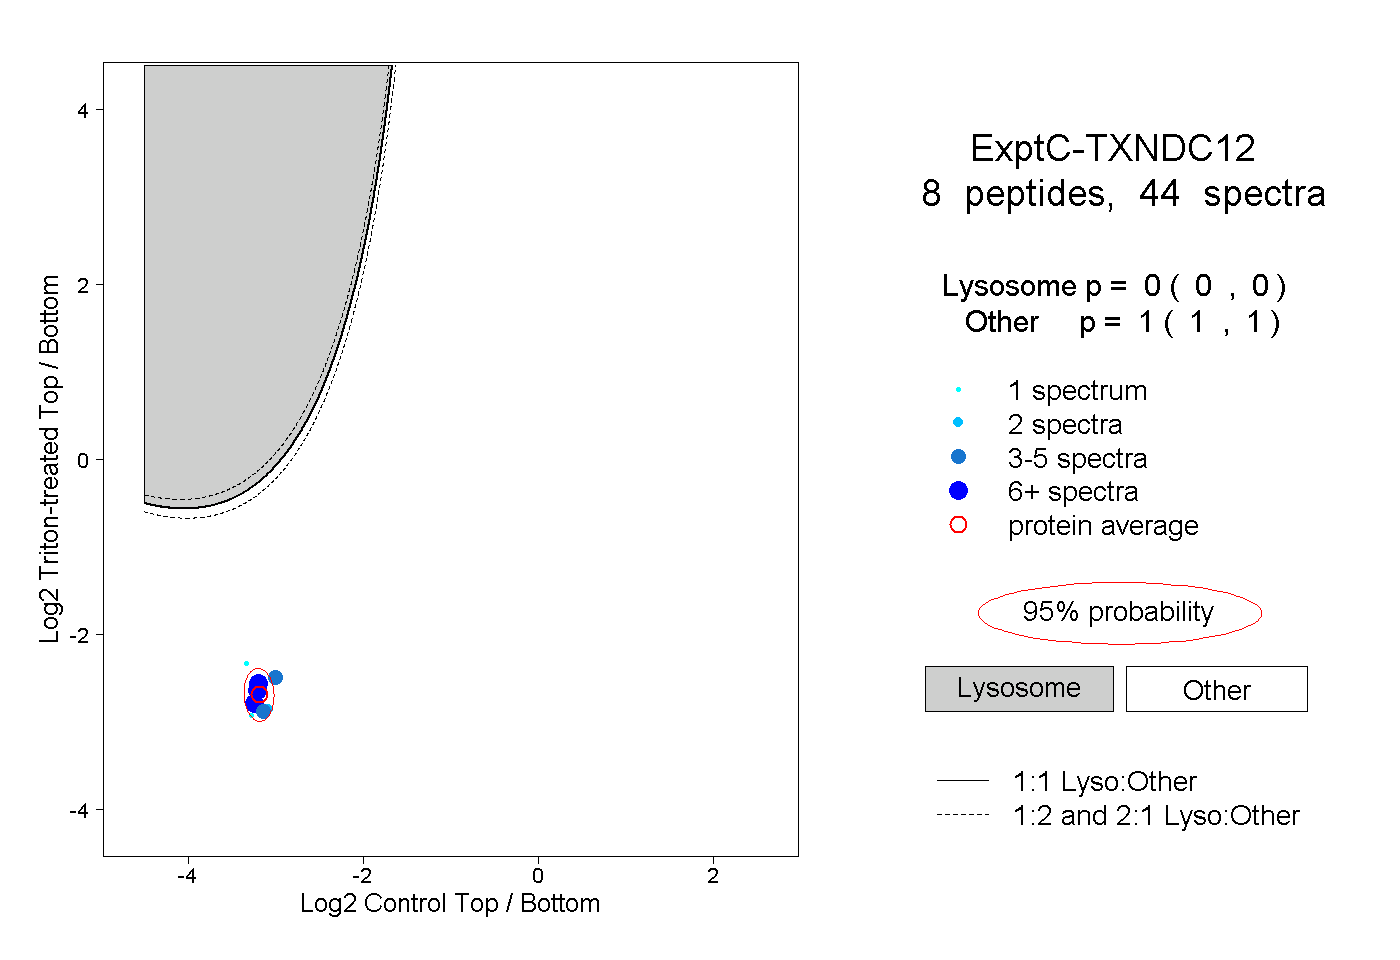
Lyso |
|
|
|
|
|
|
|
Other |
| Expt C |
8
peptides |
44
spectra |
 |
|
0.000
0.000 | 0.000 |
|
|
|
|
|
|
|
1.000
1.000 | 1.000 |
| | | Plot |
|
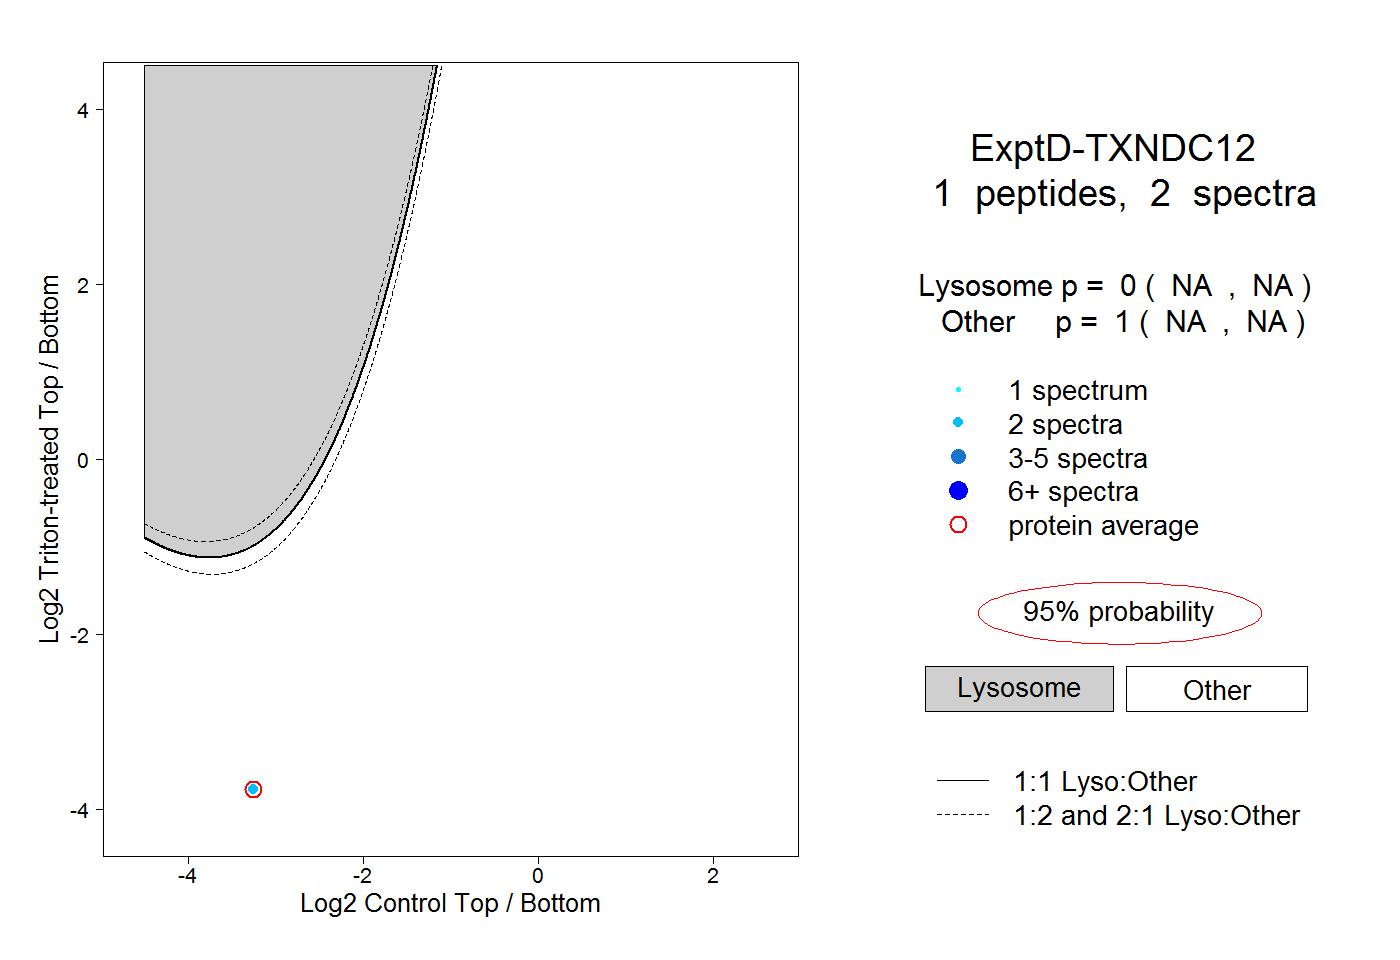
Lyso |
|
|
|
|
|
|
|
Other |
| Expt D |
1
peptide |
2
spectra |
 |
|
0.000
NA | NA |
|
|
|
|
|
|
|
1.000
NA | NA |