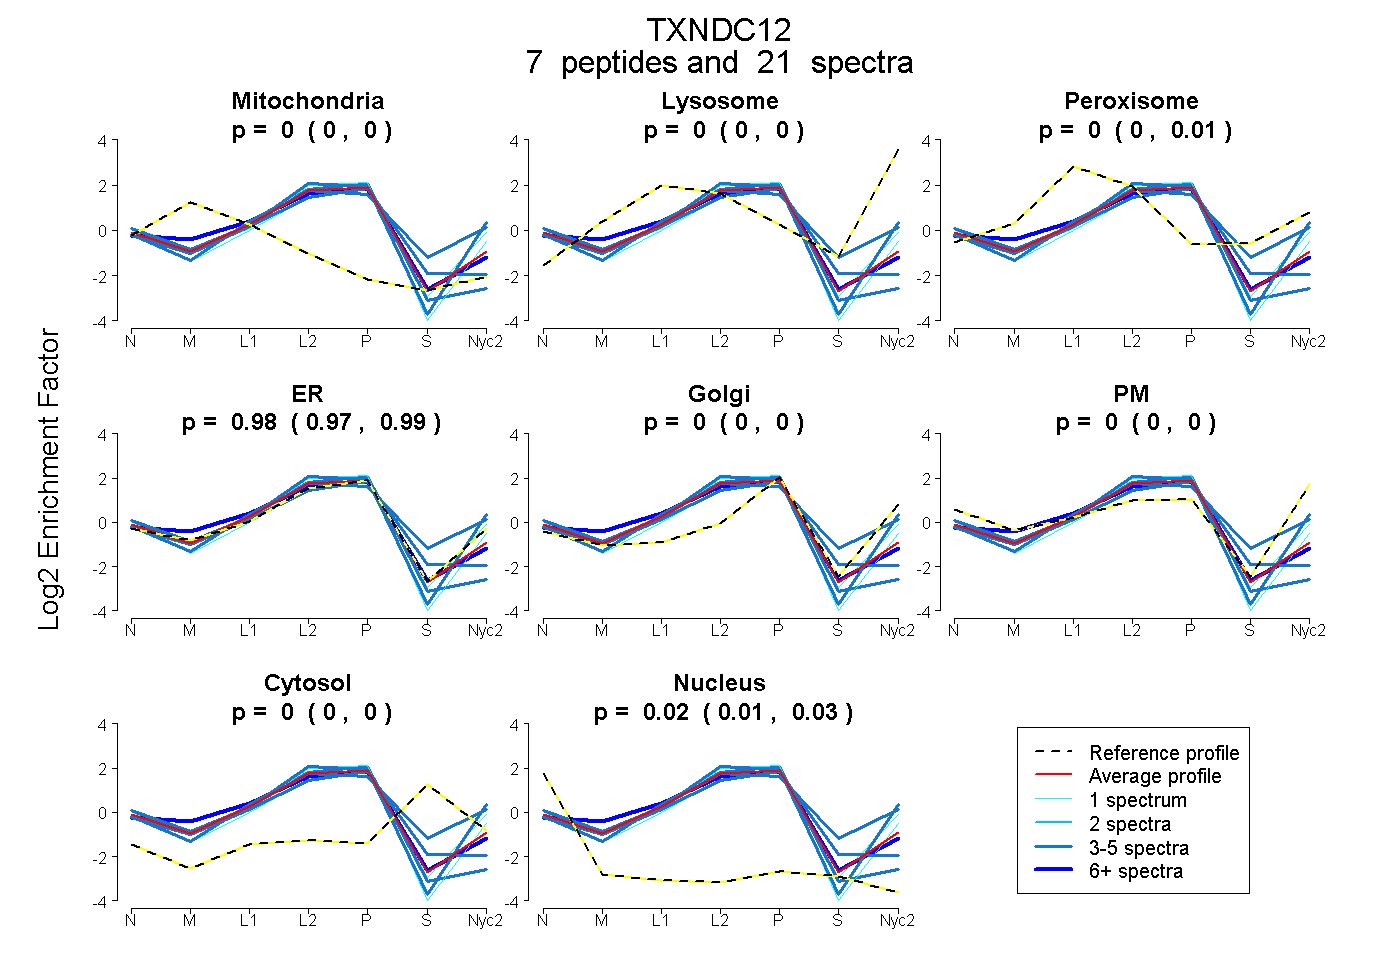
 7
7peptides
spectra
0.000 | 0.000
0.000 | 0.000
0.000 | 0.007
0.969 | 0.988
0.000 | 0.000
0.000 | 0.000
0.000 | 0.000
0.010 | 0.028
| Plot | Mito | Lyso | Perox | ER | Golgi | PM | Cytosol | Nucleus | |||||
| Expt A |
7 peptides |
21 spectra |
|
0.000 0.000 | 0.000 |
0.000 0.000 | 0.000 |
0.000 0.000 | 0.007 |
0.981 0.969 | 0.988 |
0.000 0.000 | 0.000 |
0.000 0.000 | 0.000 |
0.000 0.000 | 0.000 |
0.019 0.010 | 0.028 |
| 3 spectra, VRPEIINESGNPSYK | 0.000 | 0.000 | 0.167 | 0.668 | 0.000 | 0.073 | 0.092 | 0.000 | ||
| 1 spectrum, DEDFSPDGGYIPR | 0.000 | 0.000 | 0.000 | 0.908 | 0.072 | 0.009 | 0.000 | 0.011 | ||
| 6 spectra, EAAASGLPLMVIIHK | 0.085 | 0.000 | 0.000 | 0.915 | 0.000 | 0.000 | 0.000 | 0.000 | ||
| 1 spectrum, ILFLDPSGK | 0.000 | 0.000 | 0.000 | 1.000 | 0.000 | 0.000 | 0.000 | 0.000 | ||
| 3 spectra, GFGDHIHWR | 0.000 | 0.000 | 0.000 | 0.916 | 0.000 | 0.000 | 0.000 | 0.084 | ||
| 4 spectra, LTGDAFR | 0.000 | 0.000 | 0.000 | 0.829 | 0.000 | 0.171 | 0.000 | 0.000 | ||
| 3 spectra, SWCGACK | 0.008 | 0.000 | 0.000 | 0.879 | 0.000 | 0.000 | 0.055 | 0.058 |
| Plot | Mito | Lyso or Perox | ER | Golgi | PM | Cytosol | Nucleus | ||||||
| Expt B |
4 peptides |
8 spectra |
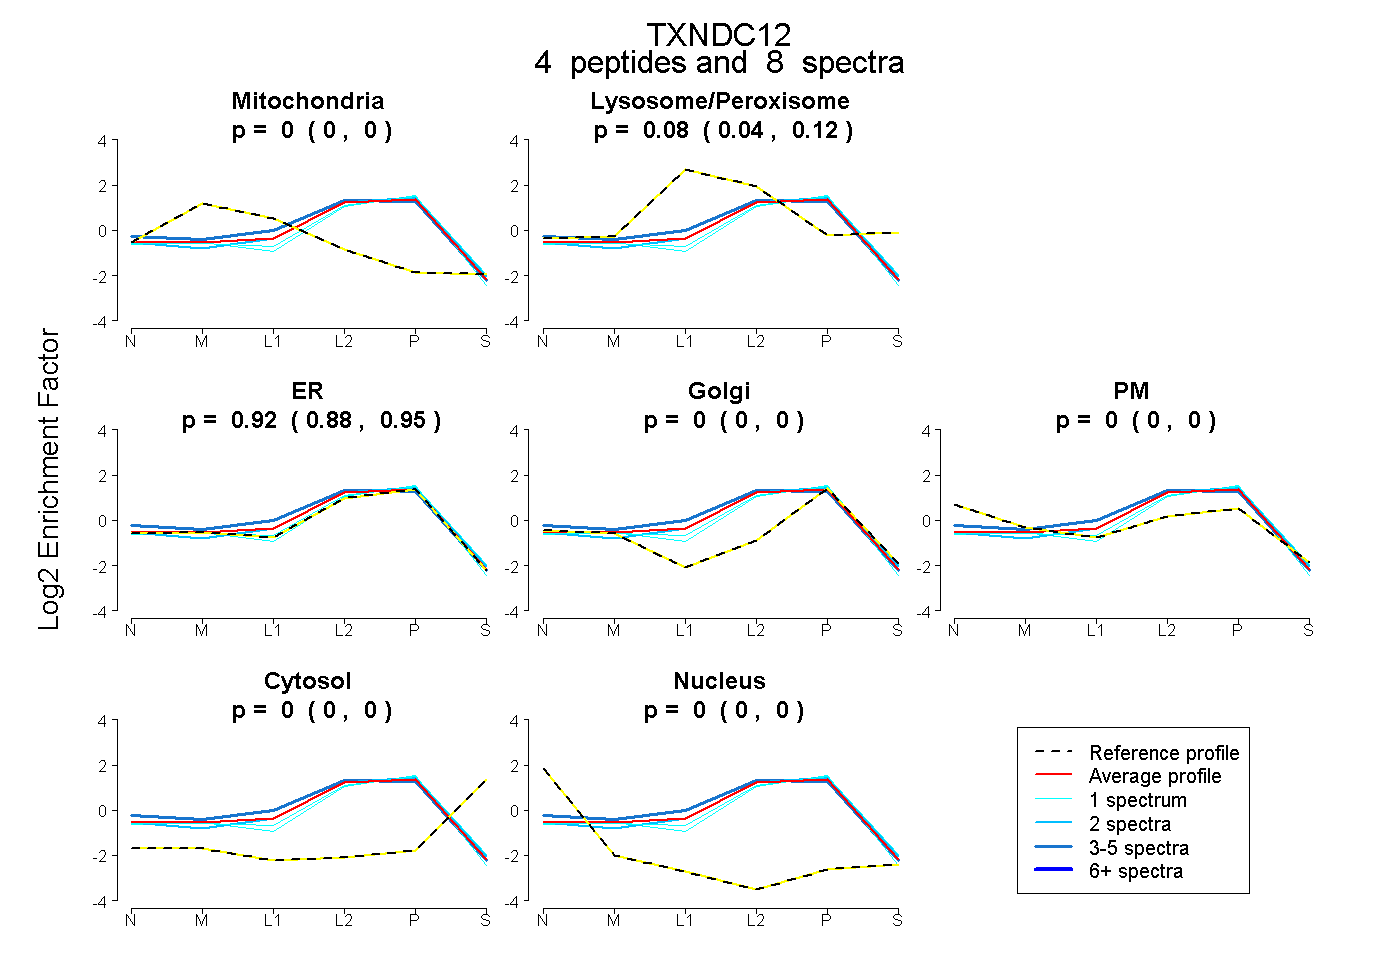 |
0.000 0.000 | 0.000 |
0.084 0.044 | 0.116 |
0.916 0.876 | 0.948 |
0.000 0.000 | 0.000 |
0.000 0.000 | 0.000 |
0.000 0.000 | 0.000 |
0.000 0.000 | 0.000 |
|||
| Plot | Lyso | Other | |||||||||||
| Expt C |
8 peptides |
44 spectra |
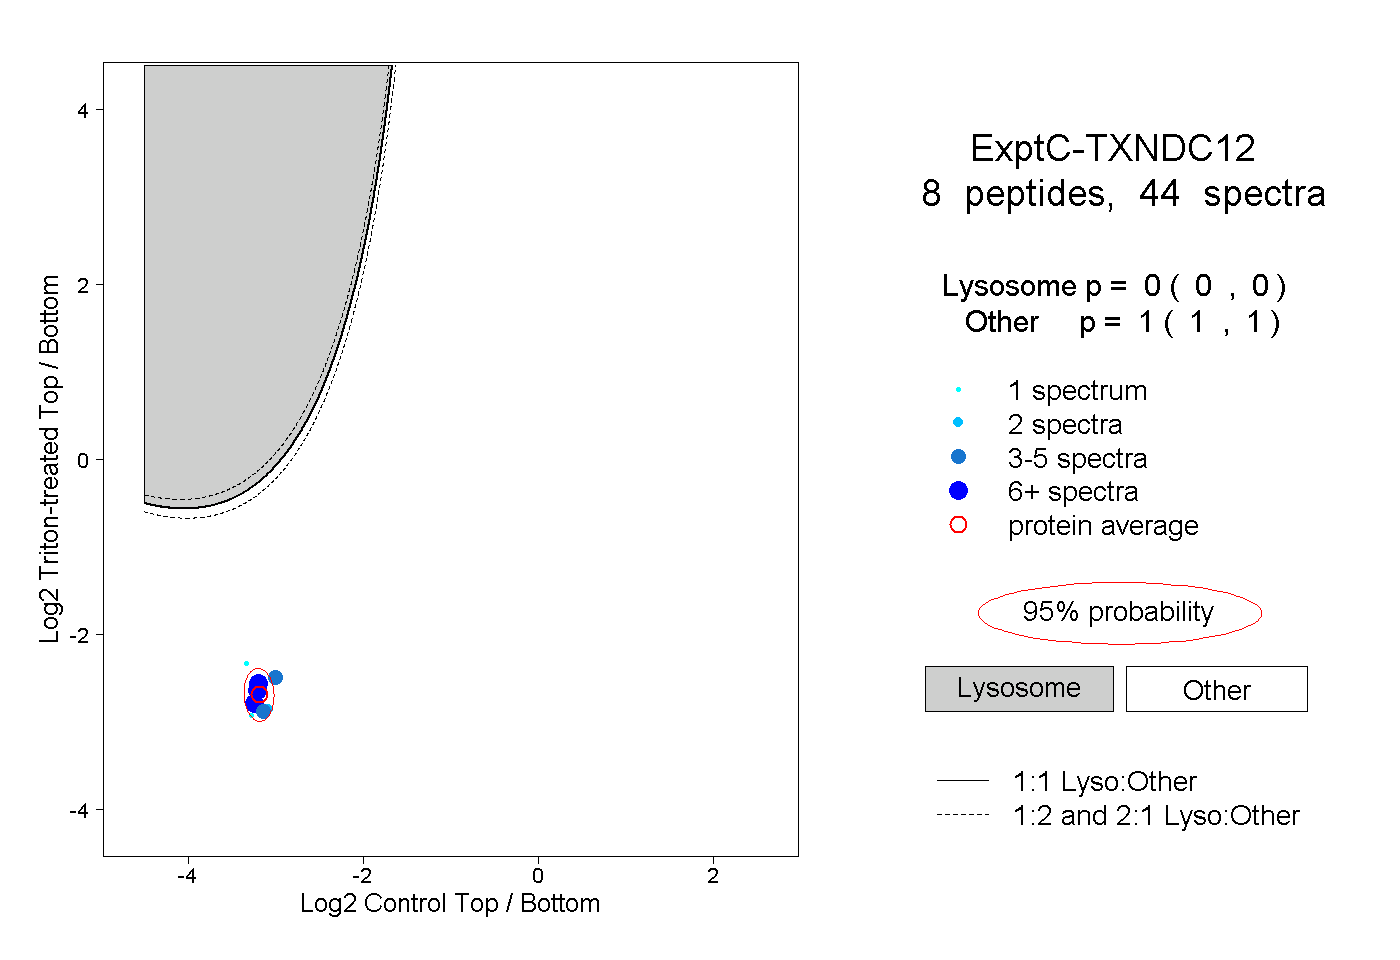 |
0.000 0.000 | 0.000 |
1.000 1.000 | 1.000 |
||||||||
| Plot | Lyso | Other | |||||||||||
| Expt D |
1 peptide |
2 spectra |
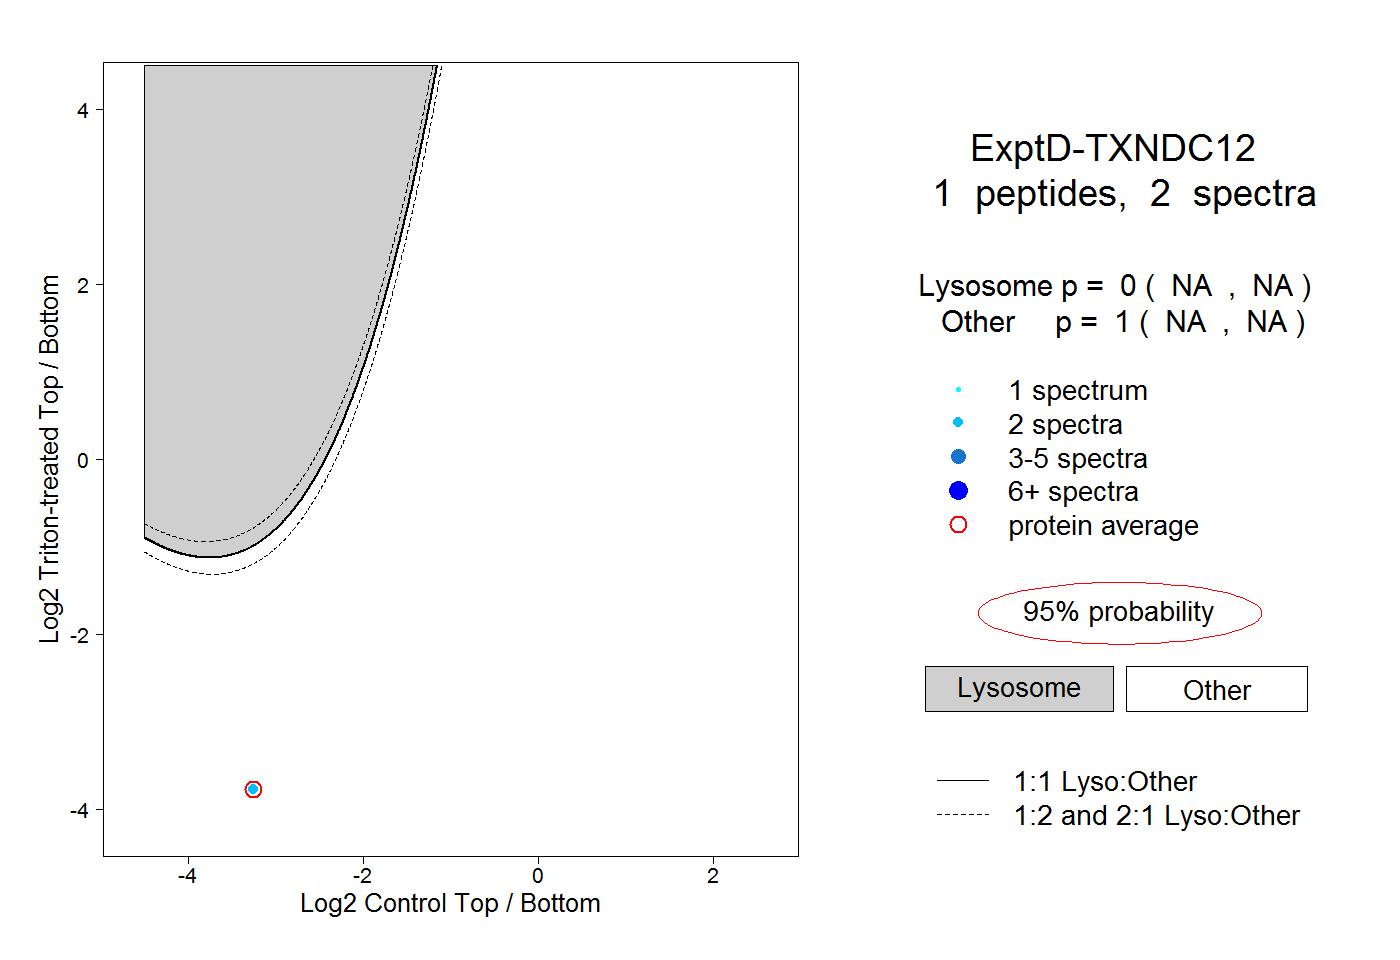 |
0.000 NA | NA |
1.000 NA | NA |