 5
5peptides
spectra
0.000 | 0.000
0.000 | 0.018
0.001 | 0.120
0.000 | 0.042
0.000 | 0.000
0.536 | 0.680
0.257 | 0.323
0.000 | 0.000
3peptides
spectra
0.000 | 0.000
1.000 | 1.000
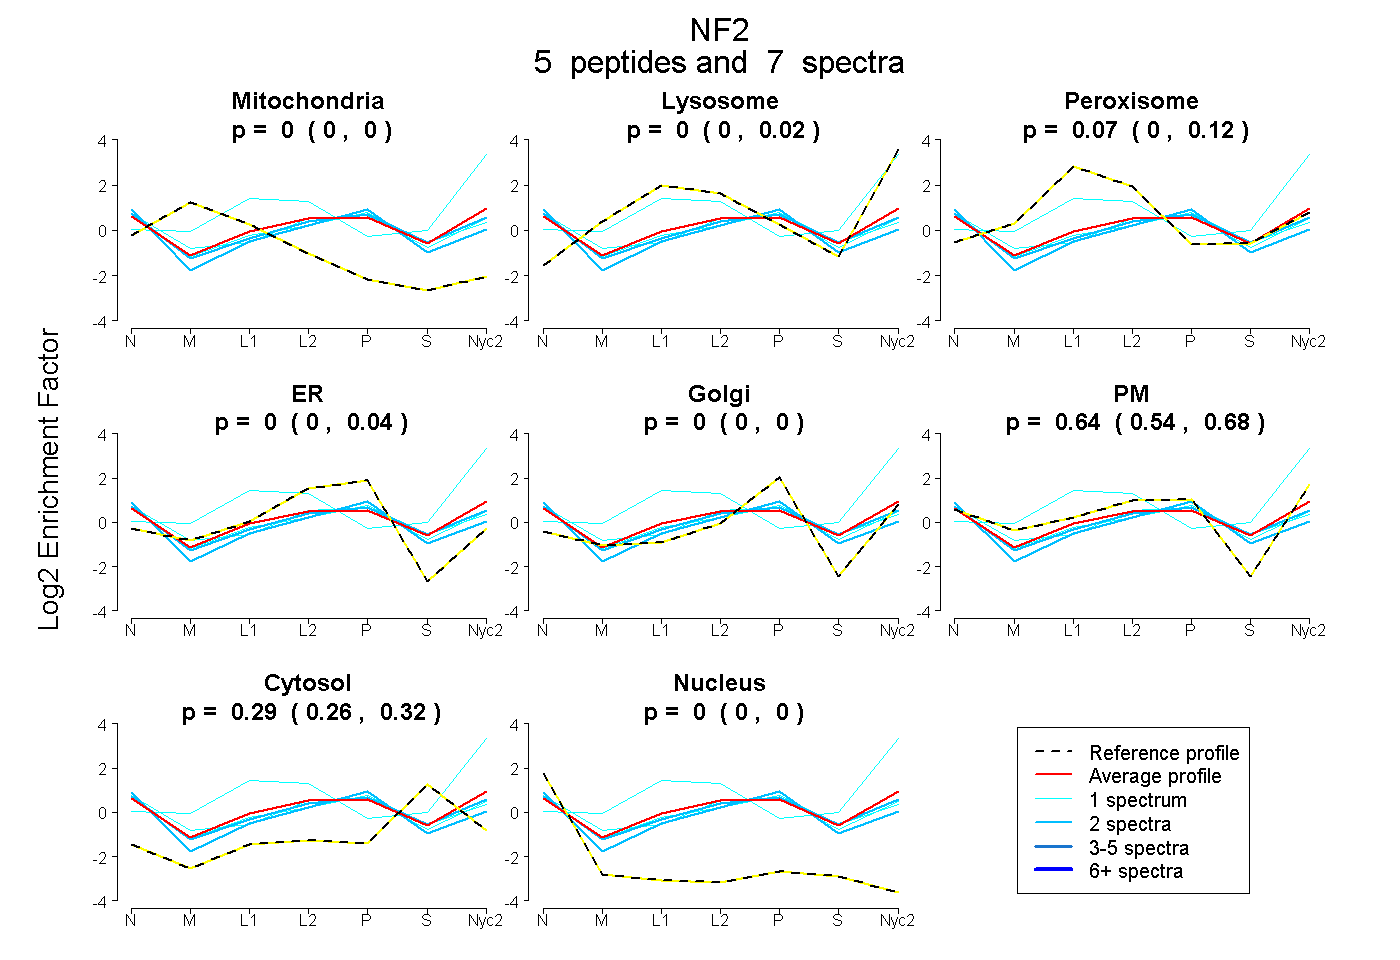
| Plot | Mito | Lyso | Perox | ER | Golgi | PM | Cytosol | Nucleus | |||||
| Expt A |
5 peptides |
7 spectra |
|
0.000 0.000 | 0.000 |
0.000 0.000 | 0.018 |
0.069 0.001 | 0.120 |
0.000 0.000 | 0.042 |
0.000 0.000 | 0.000 |
0.637 0.536 | 0.680 |
0.294 0.257 | 0.323 |
0.000 0.000 | 0.000 |
||
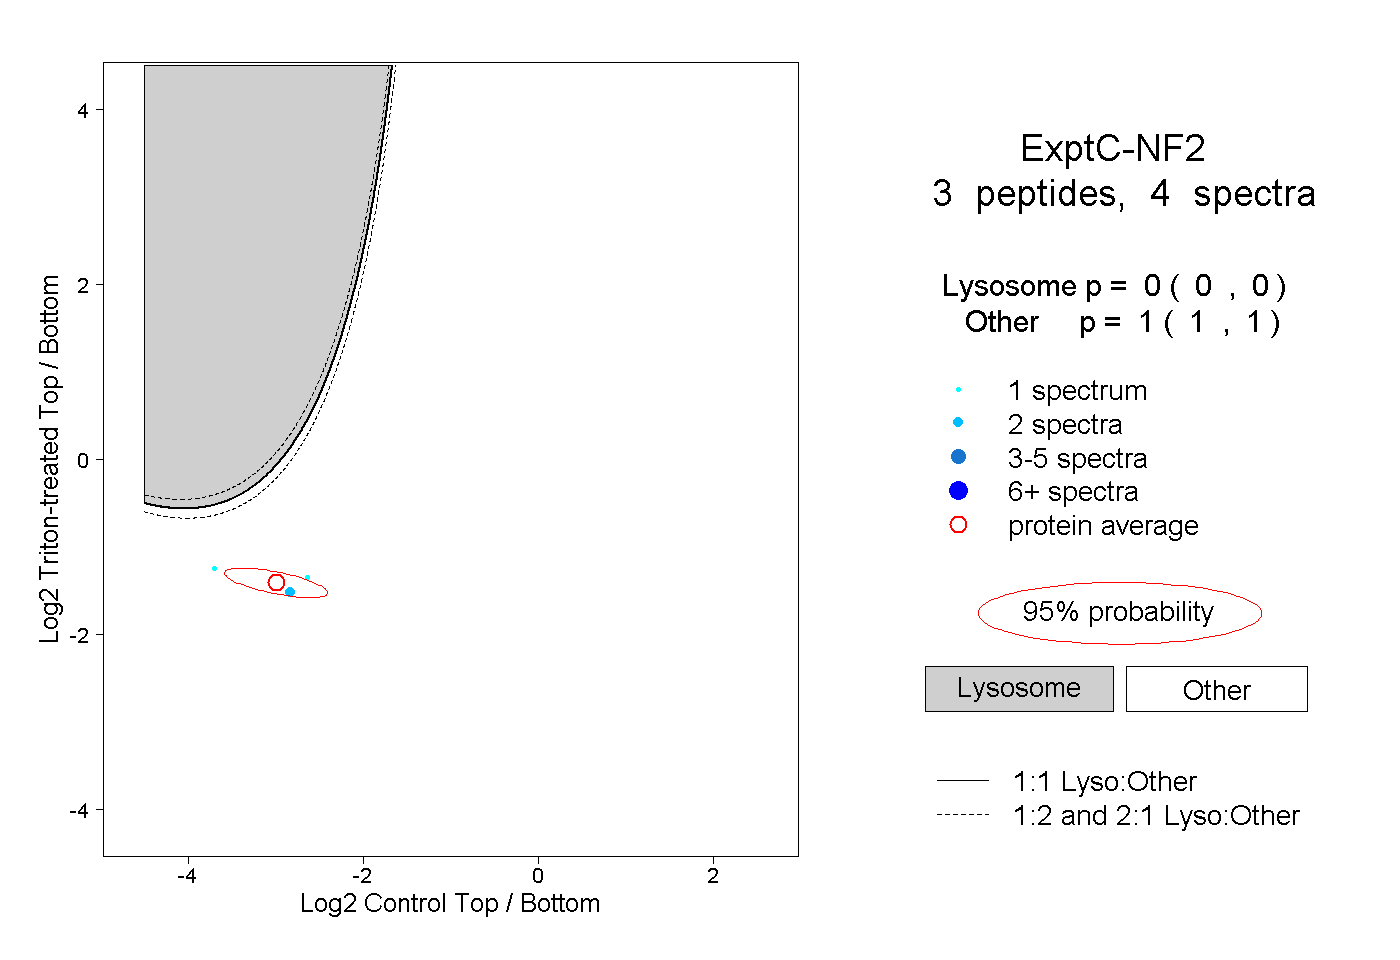
| Plot | Lyso | Other | |||||||||||
| Expt C |
3 peptides |
4 spectra |
|
0.000 0.000 | 0.000 |
1.000 1.000 | 1.000 |
| 1 spectrum, AGAIASR | 0.000 | 1.000 | ||||||||
| 1 spectrum, AAEAEQEMQR | 0.000 | 1.000 | ||||||||
| 2 spectra, AQITEEEAK | 0.000 | 1.000 |