 5
5peptides
spectra
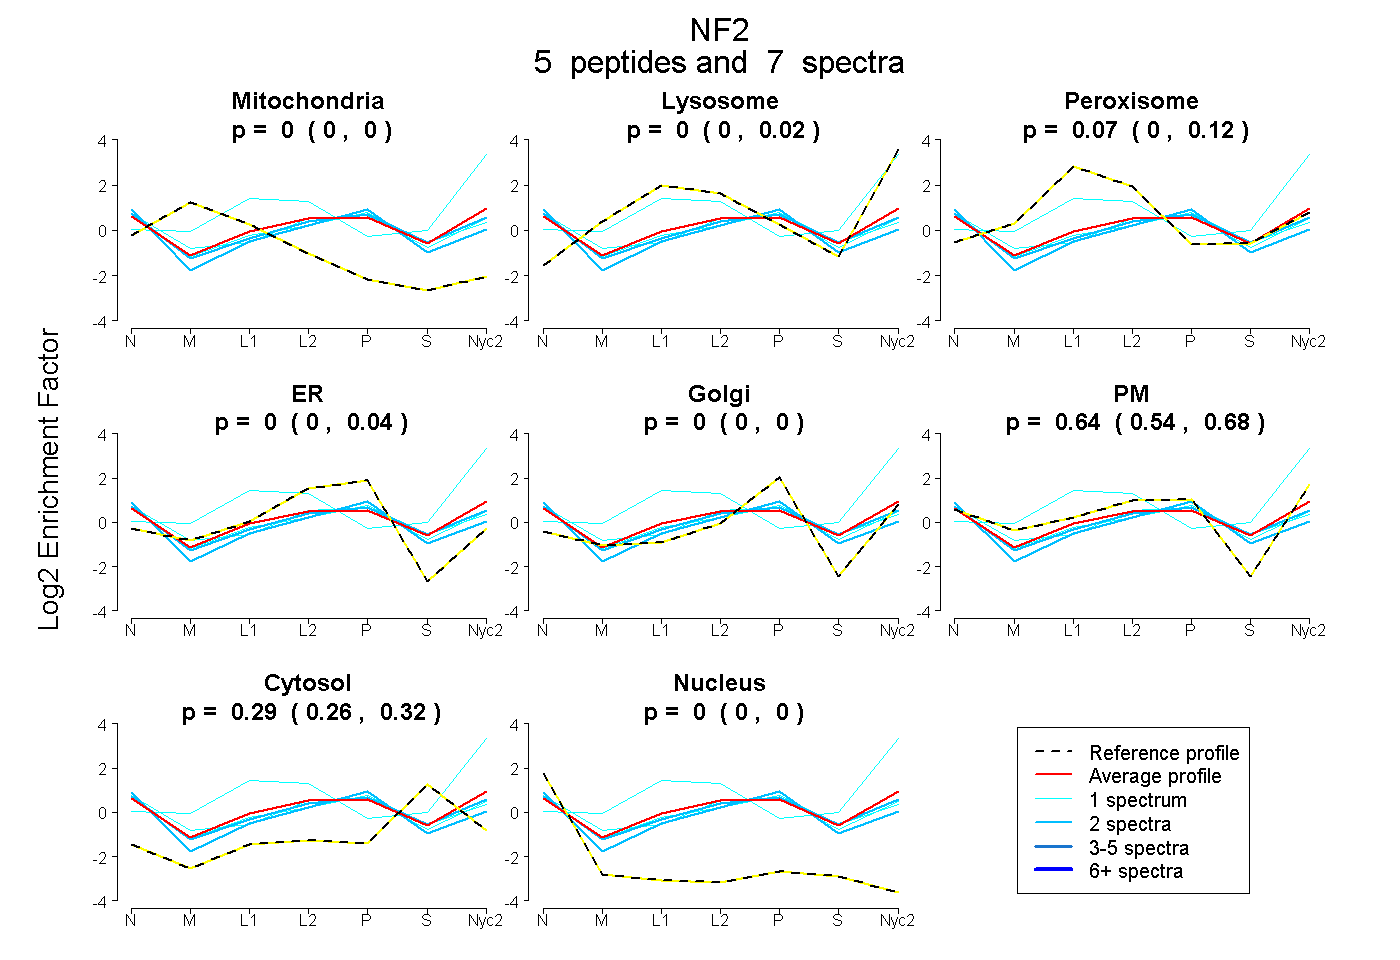
0.000 | 0.000
0.000 | 0.018
0.001 | 0.120
0.000 | 0.042
0.000 | 0.000
0.536 | 0.680
0.257 | 0.323
0.000 | 0.000
| Plot | Mito | Lyso | Perox | ER | Golgi | PM | Cytosol | Nucleus | |||||
| Expt A |
5 peptides |
7 spectra |
|
0.000 0.000 | 0.000 |
0.000 0.000 | 0.018 |
0.069 0.001 | 0.120 |
0.000 0.000 | 0.042 |
0.000 0.000 | 0.000 |
0.637 0.536 | 0.680 |
0.294 0.257 | 0.323 |
0.000 0.000 | 0.000 |
| 1 spectrum, ISFPWNEIR | 0.000 | 0.000 | 0.000 | 0.069 | 0.000 | 0.630 | 0.285 | 0.016 | ||
| 1 spectrum, ETALDILHSEHSDR | 0.000 | 0.000 | 0.003 | 0.098 | 0.000 | 0.552 | 0.340 | 0.007 | ||
| 2 spectra, KPQAQGR | 0.000 | 0.000 | 0.000 | 0.228 | 0.010 | 0.418 | 0.260 | 0.084 | ||
| 2 spectra, SEETADLLAEK | 0.000 | 0.000 | 0.000 | 0.042 | 0.000 | 0.617 | 0.342 | 0.000 | ||
| 1 spectrum, AQITEEEAK | 0.000 | 0.695 | 0.098 | 0.000 | 0.000 | 0.089 | 0.118 | 0.000 |
| Plot | Lyso | Other | |||||||||||
| Expt C |
3 peptides |
4 spectra |
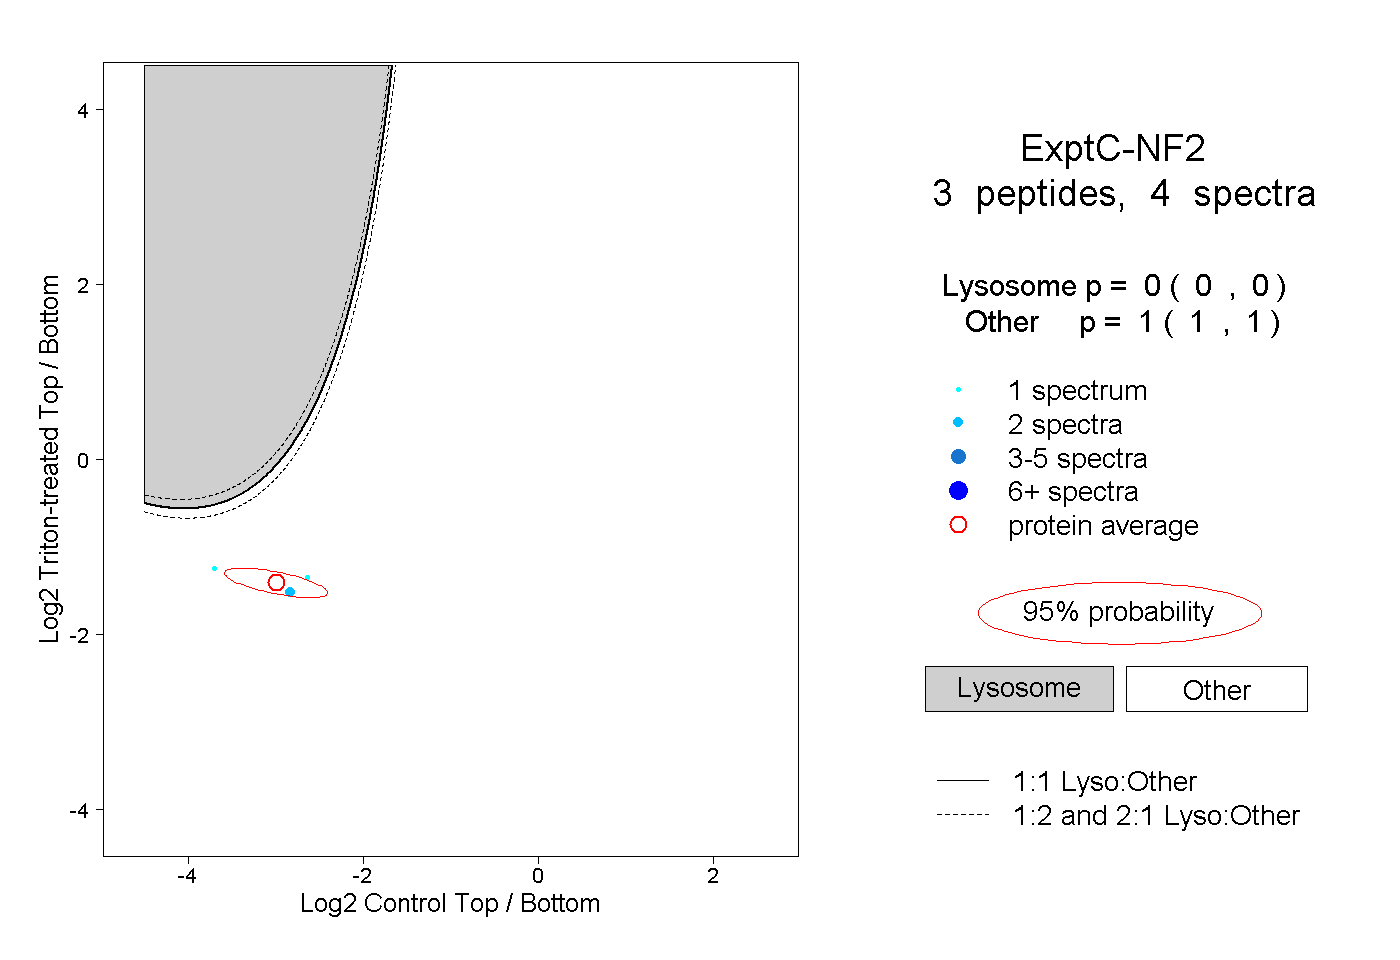 |
0.000 0.000 | 0.000 |
1.000 1.000 | 1.000 |