12
12peptides
spectra
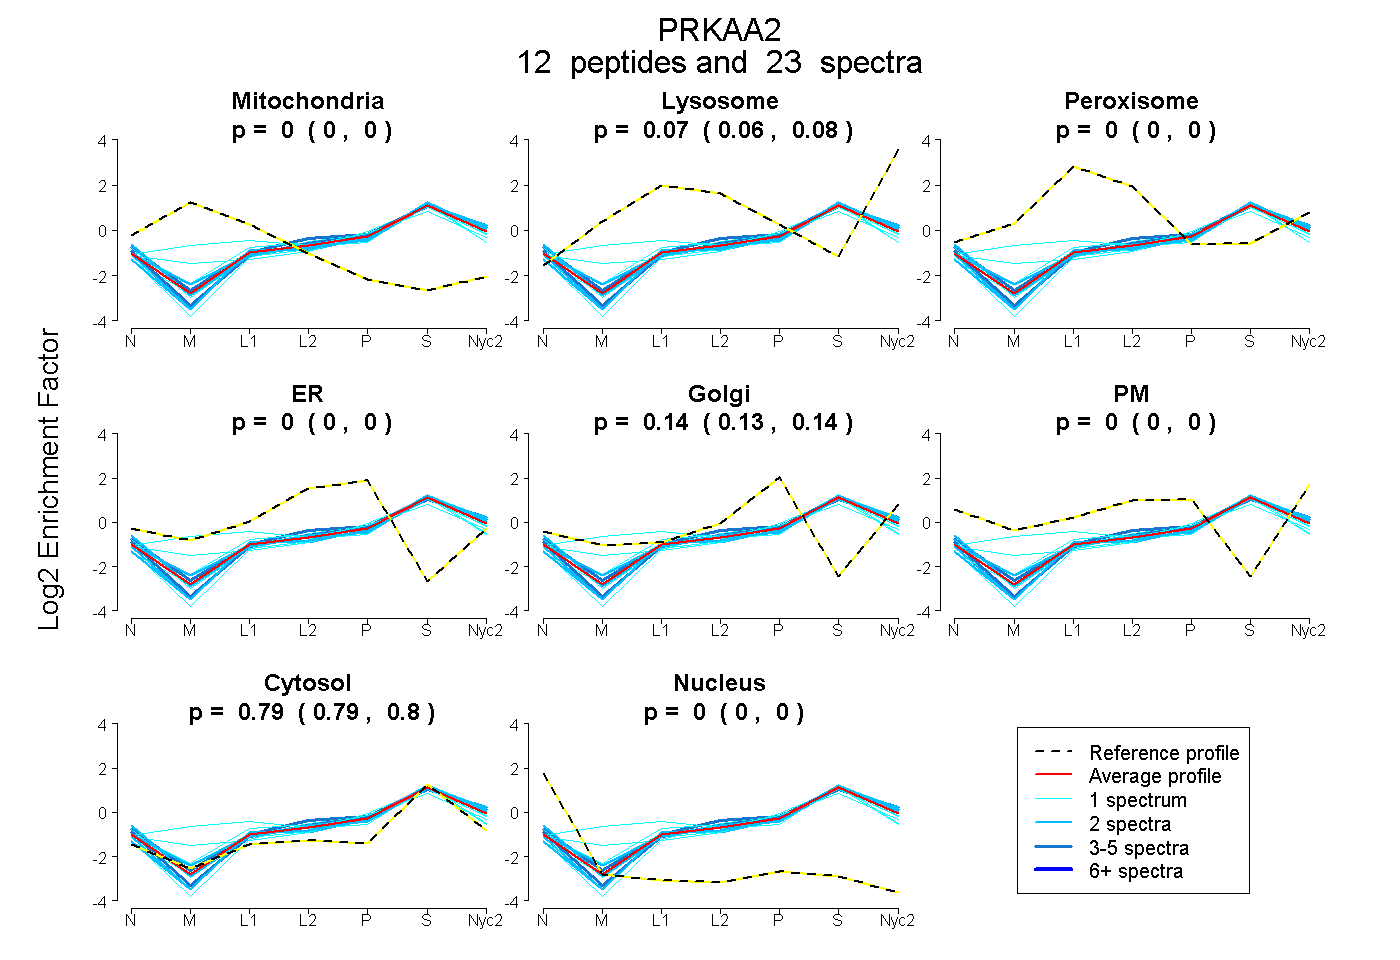
0.000 | 0.000
0.063 | 0.076
0.000 | 0.000
0.000 | 0.000
0.132 | 0.140
0.000 | 0.000
0.788 | 0.799
0.000 | 0.000
5peptides
spectra
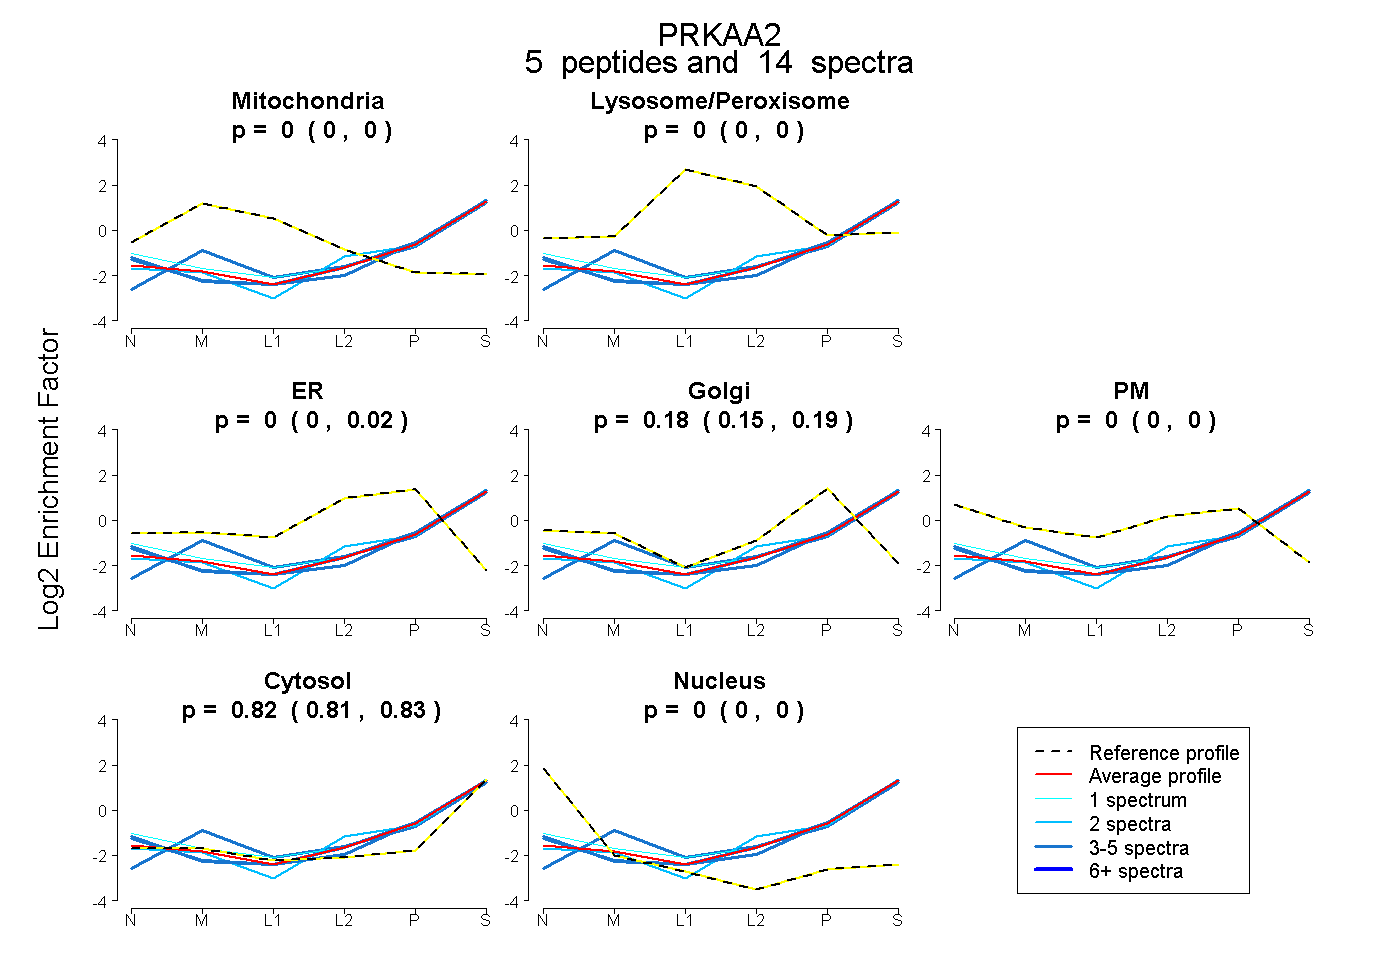
0.000 | 0.000
0.000 | 0.000
0.000 | 0.022
0.146 | 0.186
0.000 | 0.000
0.812 | 0.831
0.000 | 0.000