 12
12peptides
spectra
0.000 | 0.000
0.063 | 0.076
0.000 | 0.000
0.000 | 0.000
0.132 | 0.140
0.000 | 0.000
0.788 | 0.799
0.000 | 0.000
| Plot | Mito | Lyso | Perox | ER | Golgi | PM | Cytosol | Nucleus | |||||
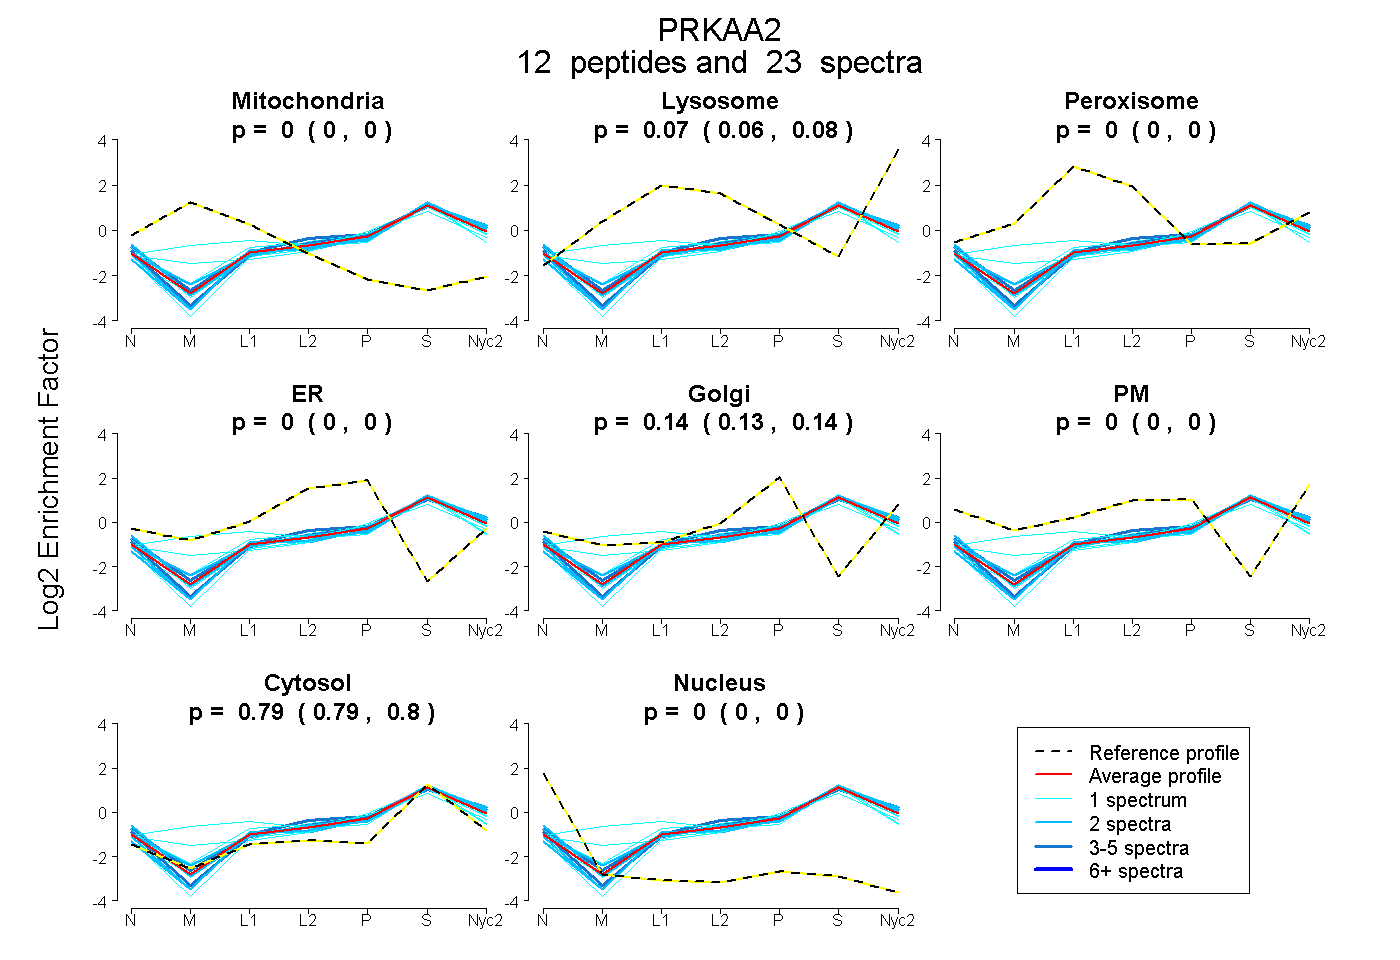
| Expt A |
12 peptides |
23 spectra |
|
0.000 0.000 | 0.000 |
0.070 0.063 | 0.076 |
0.000 0.000 | 0.000 |
0.000 0.000 | 0.000 |
0.136 0.132 | 0.140 |
0.000 0.000 | 0.000 |
0.794 0.788 | 0.799 |
0.000 0.000 | 0.000 |
| 4 spectra, EHEWFK | 0.000 | 0.062 | 0.000 | 0.000 | 0.060 | 0.133 | 0.746 | 0.000 | ||
| 1 spectrum, VVNAYHLR | 0.043 | 0.036 | 0.193 | 0.000 | 0.141 | 0.000 | 0.587 | 0.000 | ||
| 2 spectra, GGVFYIPEYLNR | 0.000 | 0.052 | 0.000 | 0.000 | 0.105 | 0.000 | 0.843 | 0.000 | ||
| 1 spectrum, IGEHQLTGHK | 0.000 | 0.075 | 0.000 | 0.000 | 0.194 | 0.000 | 0.731 | 0.000 | ||
| 1 spectrum, HPHIIK | 0.000 | 0.035 | 0.000 | 0.000 | 0.130 | 0.000 | 0.836 | 0.000 | ||
| 2 spectra, SQSKPYDIMAEVYR | 0.000 | 0.058 | 0.000 | 0.000 | 0.086 | 0.000 | 0.856 | 0.000 | ||
| 1 spectrum, SGSSTPQR | 0.000 | 0.000 | 0.000 | 0.000 | 0.212 | 0.000 | 0.788 | 0.000 | ||
| 2 spectra, SYLLDFK | 0.000 | 0.000 | 0.000 | 0.000 | 0.000 | 0.190 | 0.810 | 0.000 | ||
| 5 spectra, SIDDEVVEQR | 0.000 | 0.043 | 0.000 | 0.000 | 0.149 | 0.000 | 0.808 | 0.000 | ||
| 2 spectra, VEEVEAR | 0.000 | 0.120 | 0.000 | 0.000 | 0.115 | 0.000 | 0.765 | 0.000 | ||
| 1 spectrum, MPPLIADSPK | 0.000 | 0.000 | 0.081 | 0.132 | 0.003 | 0.000 | 0.785 | 0.000 | ||
| 1 spectrum, IGHYVLGDTLGVGTFGK | 0.000 | 0.044 | 0.000 | 0.089 | 0.000 | 0.000 | 0.868 | 0.000 |
| Plot | Mito | Lyso or Perox | ER | Golgi | PM | Cytosol | Nucleus | ||||||
| Expt B |
5 peptides |
14 spectra |
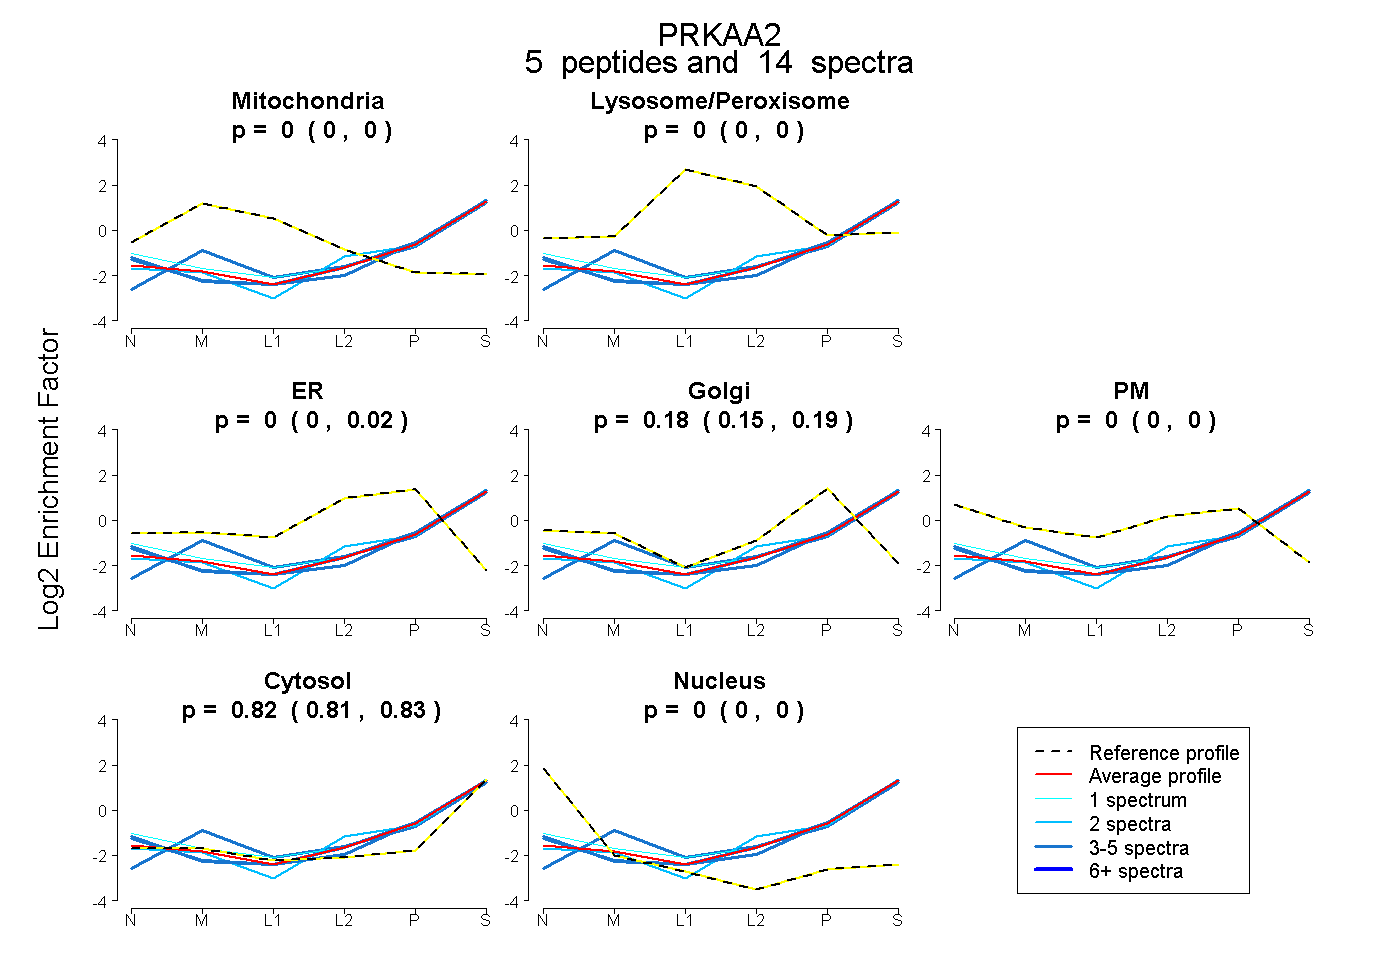 |
0.000 0.000 | 0.000 |
0.000 0.000 | 0.000 |
0.000 0.000 | 0.022 |
0.178 0.146 | 0.186 |
0.000 0.000 | 0.000 |
0.822 0.812 | 0.831 |
0.000 0.000 | 0.000 |
|||
| Plot | Lyso | Other | |||||||||||
| Expt C |
15 peptides |
58 spectra |
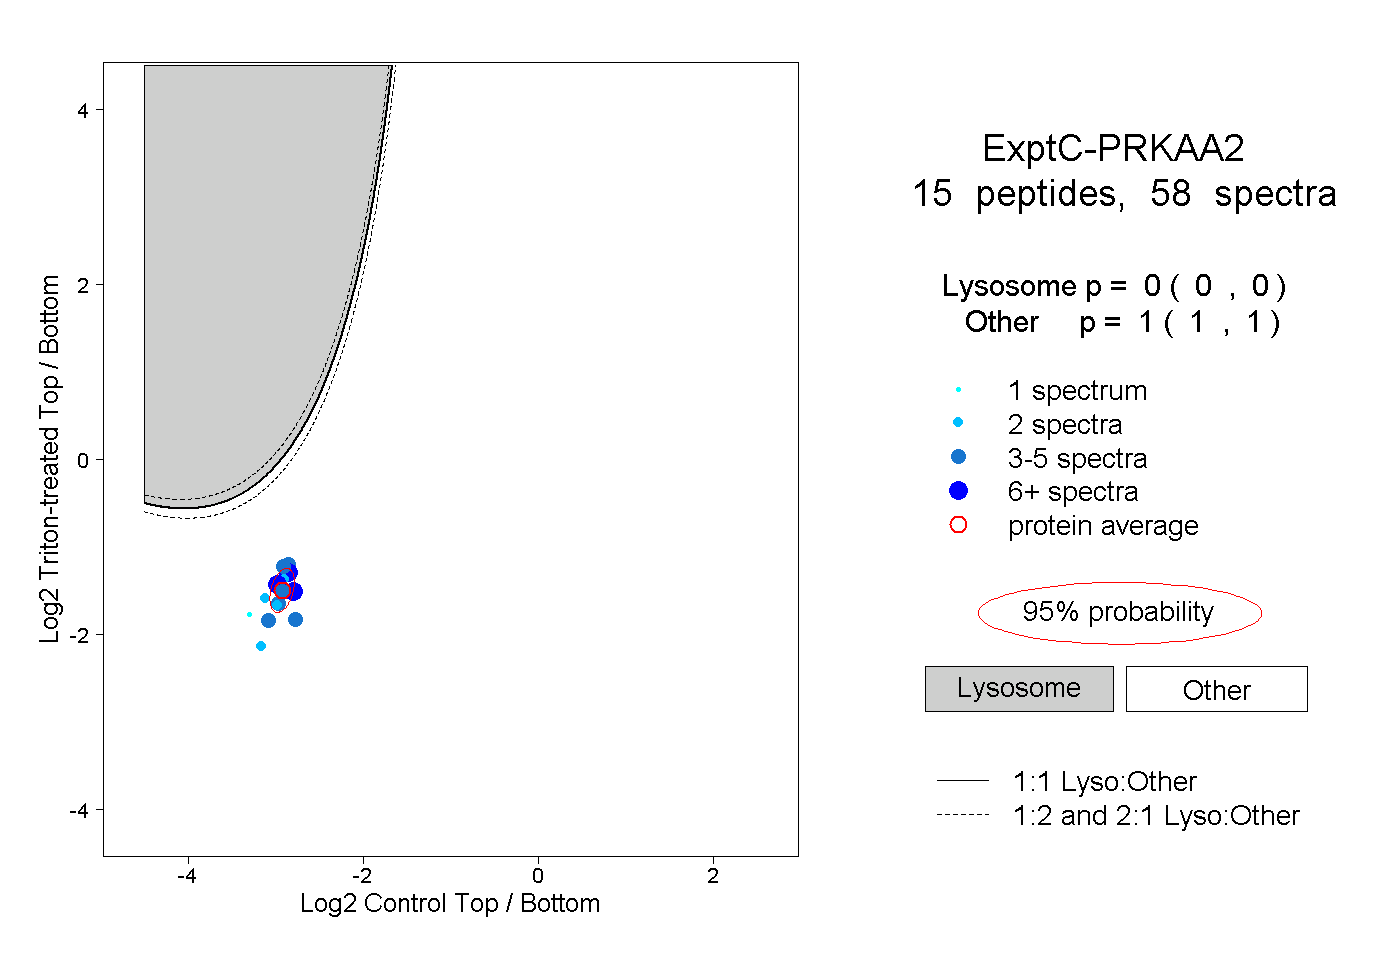 |
0.000 0.000 | 0.000 |
1.000 1.000 | 1.000 |
||||||||
| Plot | Lyso | Other | |||||||||||
| Expt D |
2 peptides |
3 spectra |
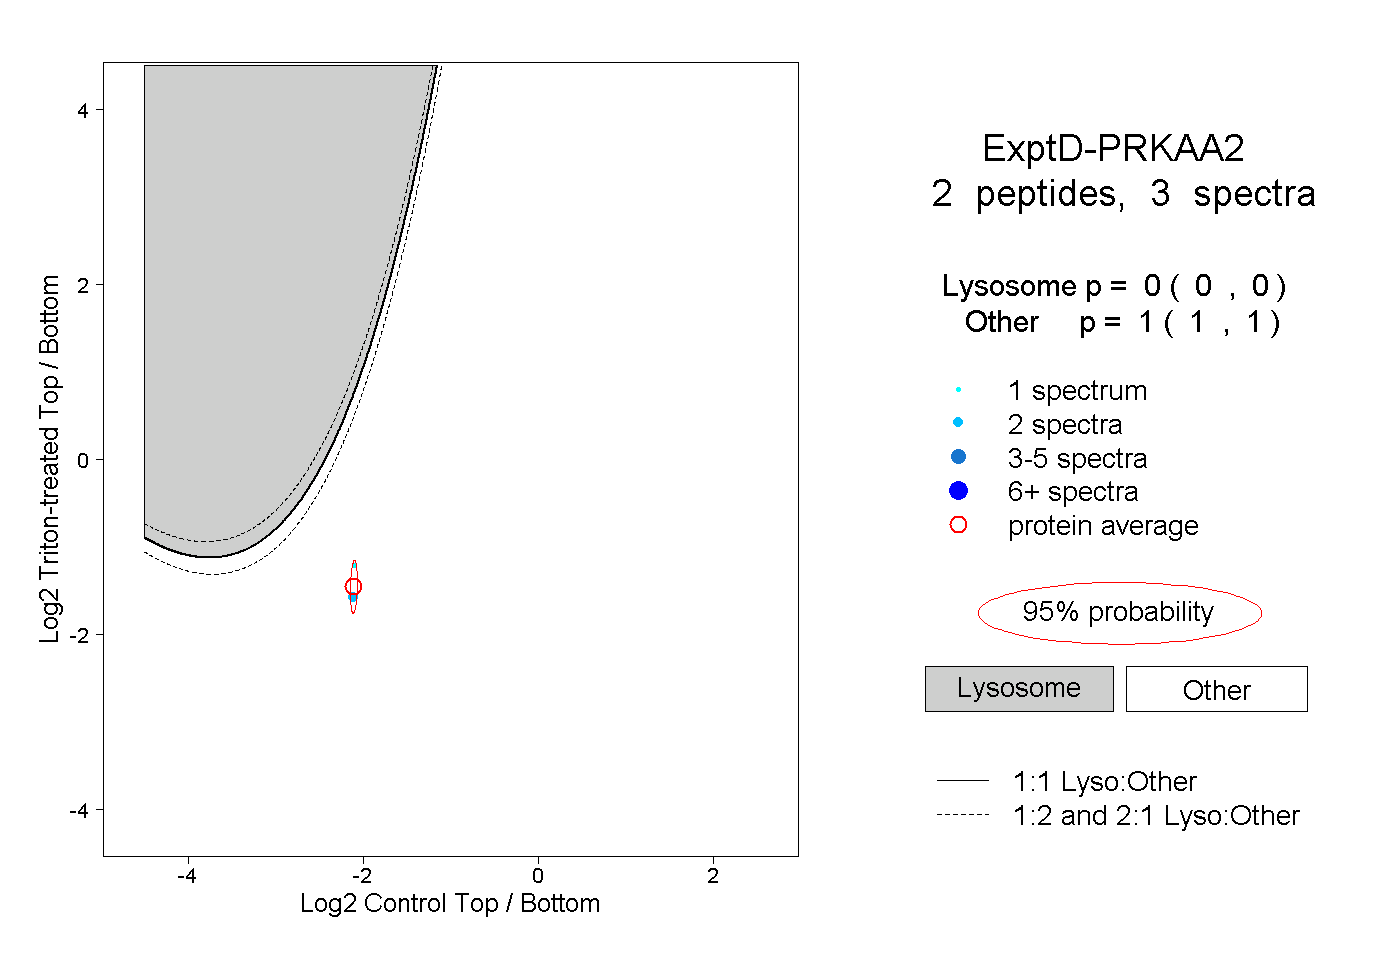 |
0.000 0.000 | 0.000 |
1.000 1.000 | 1.000 |