32
32peptides
spectra
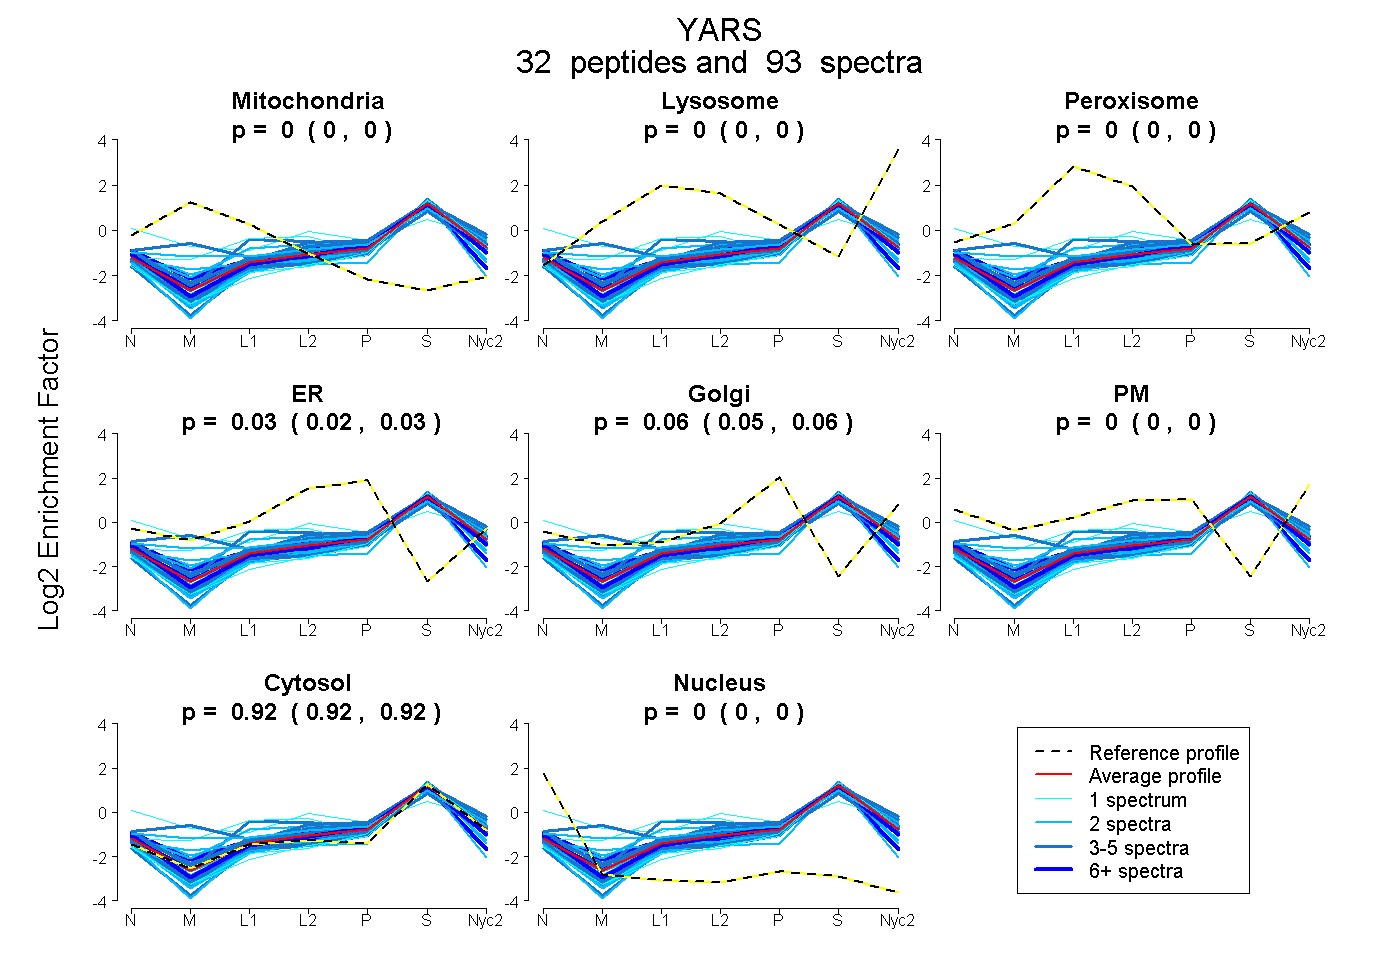
0.000 | 0.000
0.000 | 0.000
0.000 | 0.000
0.021 | 0.032
0.049 | 0.061
0.000 | 0.000
0.916 | 0.919
0.000 | 0.000
10peptides
spectra
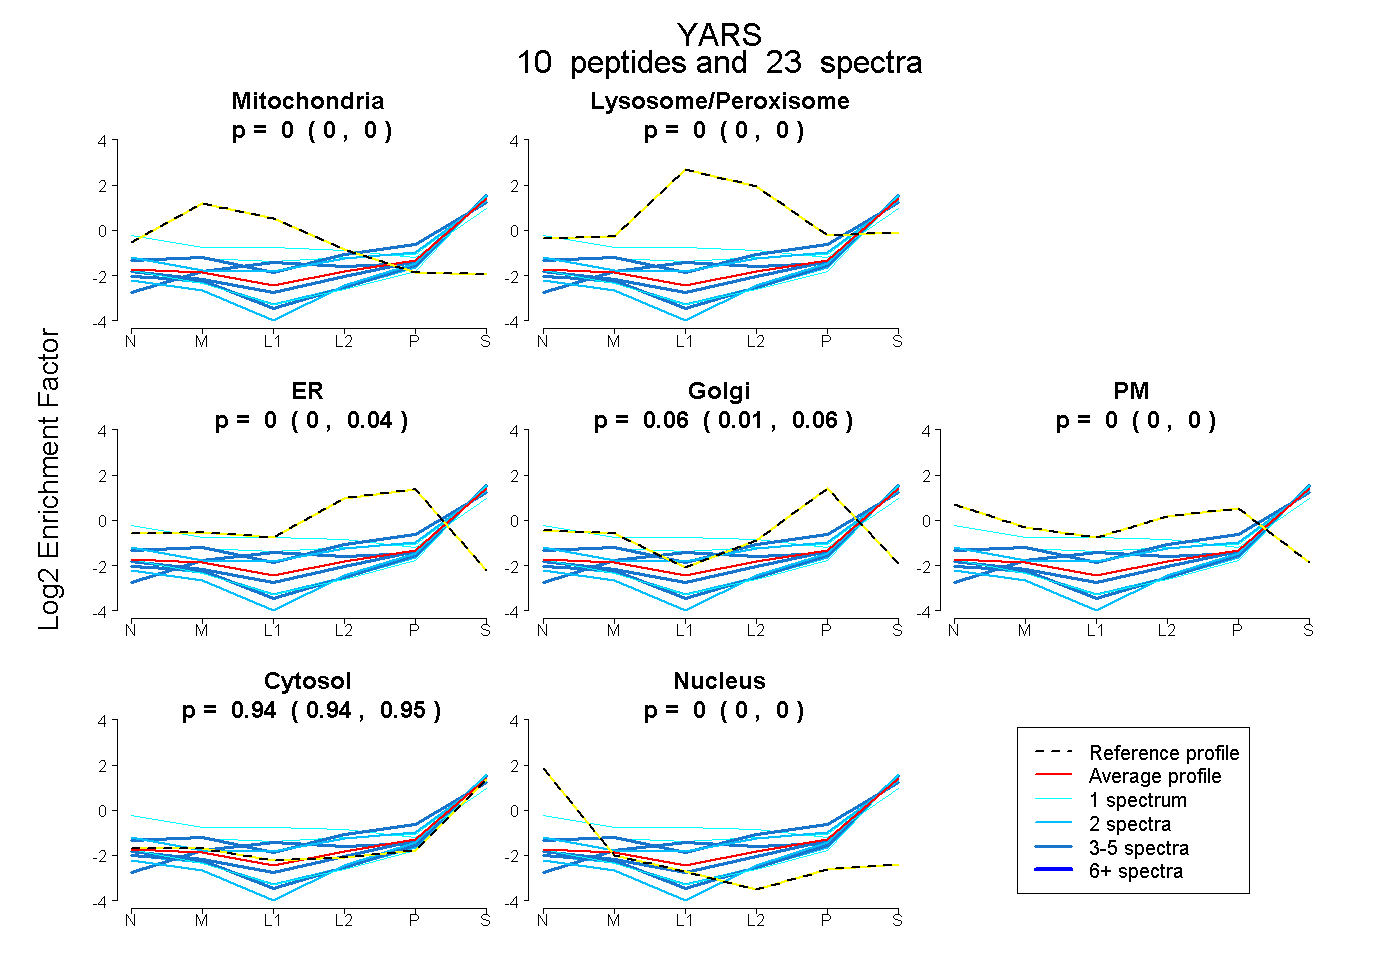
0.000 | 0.000
0.000 | 0.000
0.000 | 0.038
0.008 | 0.061
0.000 | 0.000
0.937 | 0.954
0.000 | 0.000
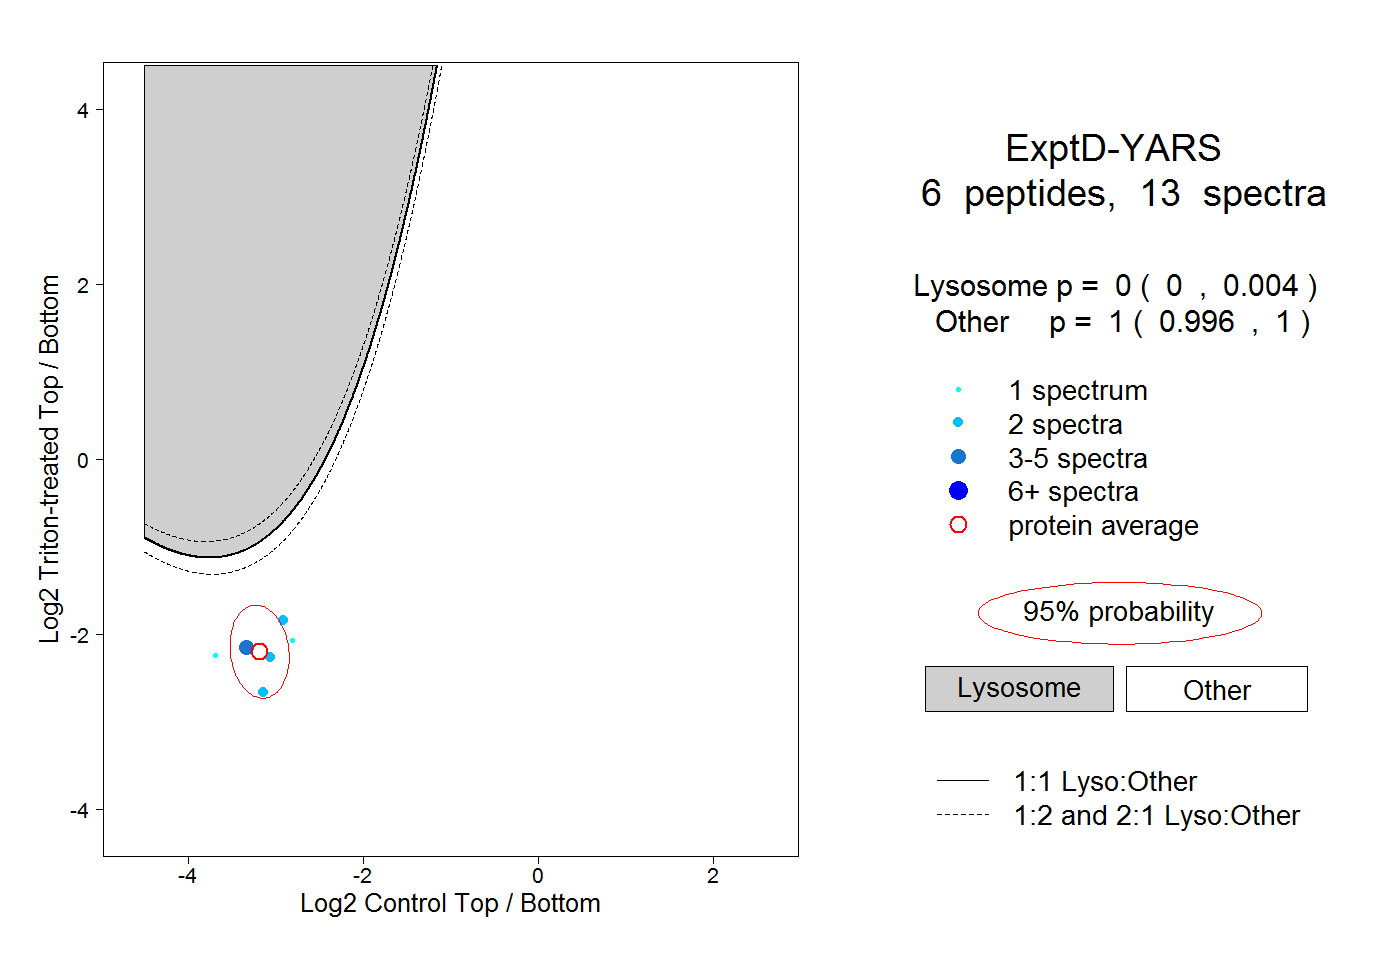
24peptides
spectra
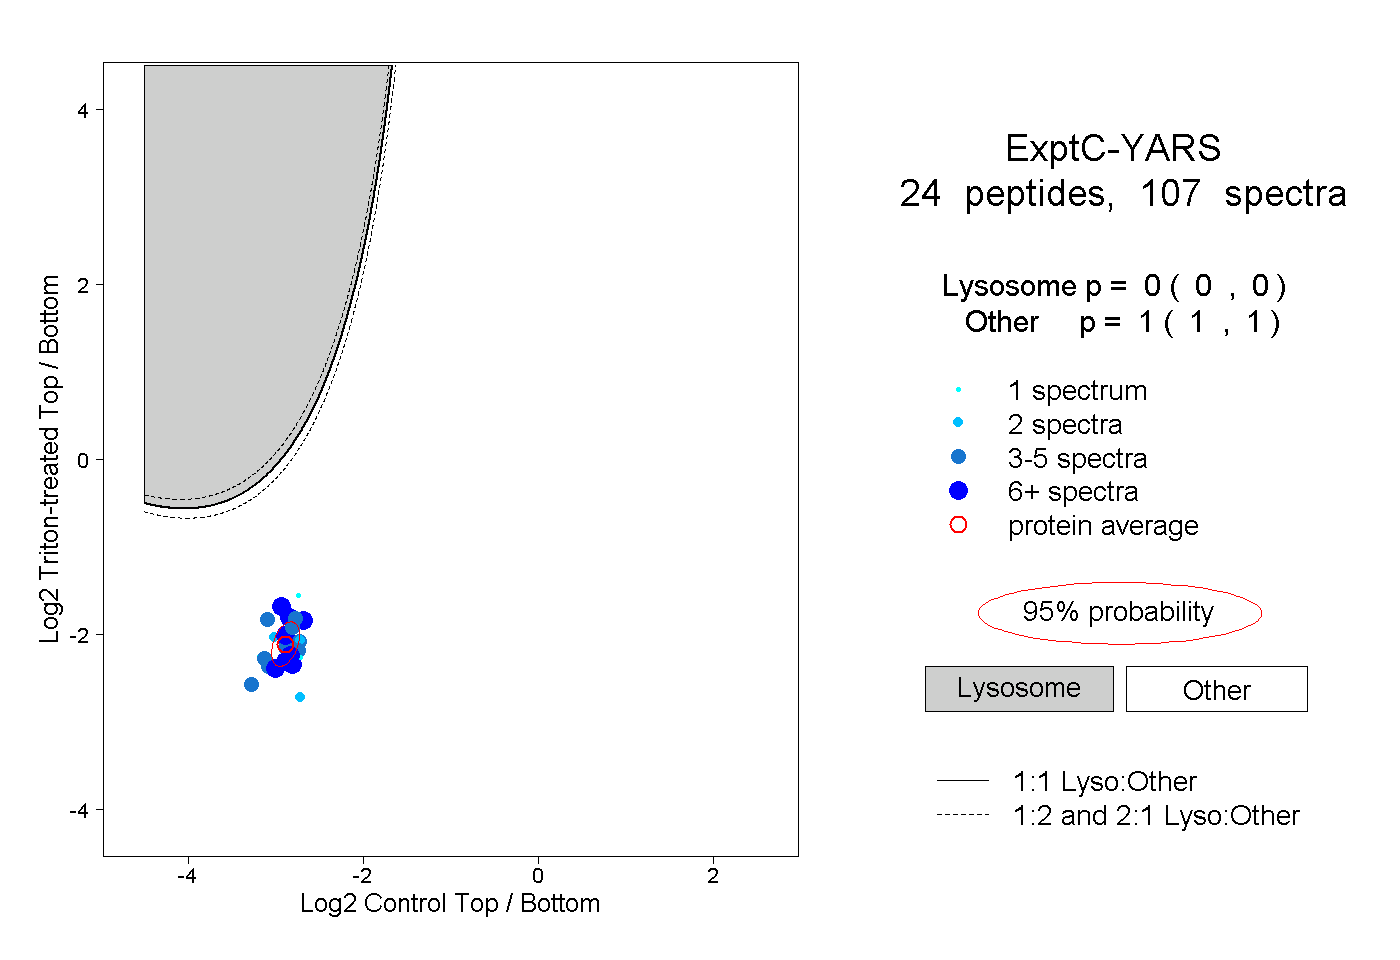
0.000 | 0.000
1.000 | 1.000