 32
32peptides
spectra
0.000 | 0.000
0.000 | 0.000
0.000 | 0.000
0.021 | 0.032
0.049 | 0.061
0.000 | 0.000
0.916 | 0.919
0.000 | 0.000
| Plot | Mito | Lyso | Perox | ER | Golgi | PM | Cytosol | Nucleus | |||||
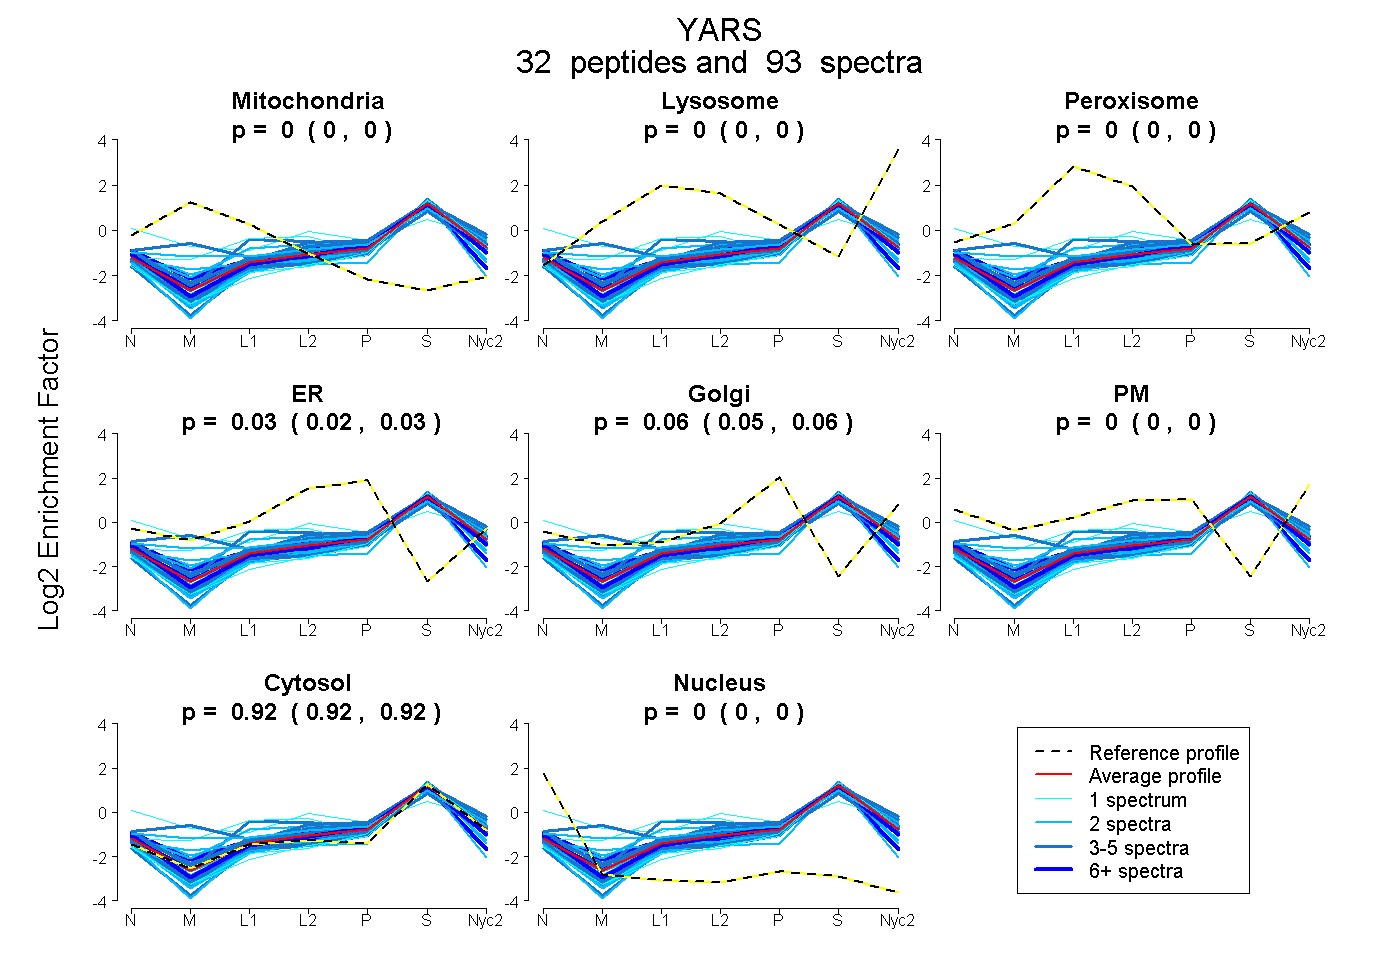
| Expt A |
32 peptides |
93 spectra |
|
0.000 0.000 | 0.000 |
0.000 0.000 | 0.000 |
0.000 0.000 | 0.000 |
0.027 0.021 | 0.032 |
0.055 0.049 | 0.061 |
0.000 0.000 | 0.000 |
0.918 0.916 | 0.919 |
0.000 0.000 | 0.000 |
| 1 spectrum, TVVSGLVQFVPK | 0.000 | 0.000 | 0.000 | 0.000 | 0.000 | 0.000 | 0.988 | 0.012 | ||
| 3 spectra, IDVGEAEPR | 0.000 | 0.000 | 0.155 | 0.032 | 0.000 | 0.000 | 0.813 | 0.000 | ||
| 2 spectra, ILSVEK | 0.000 | 0.000 | 0.000 | 0.000 | 0.042 | 0.000 | 0.958 | 0.000 | ||
| 2 spectra, QTNFMTK | 0.000 | 0.000 | 0.000 | 0.000 | 0.113 | 0.000 | 0.887 | 0.000 | ||
| 1 spectrum, HPDADSLYVEK | 0.072 | 0.000 | 0.091 | 0.000 | 0.000 | 0.285 | 0.552 | 0.000 | ||
| 3 spectra, TSYYENVIK | 0.000 | 0.000 | 0.000 | 0.000 | 0.023 | 0.000 | 0.967 | 0.011 | ||
| 2 spectra, SEFVILR | 0.000 | 0.000 | 0.000 | 0.000 | 0.000 | 0.000 | 1.000 | 0.000 | ||
| 2 spectra, YLPTLGYSK | 0.066 | 0.000 | 0.096 | 0.000 | 0.113 | 0.000 | 0.725 | 0.000 | ||
| 2 spectra, EYTLDVYR | 0.000 | 0.000 | 0.000 | 0.000 | 0.000 | 0.000 | 1.000 | 0.000 | ||
| 6 spectra, VFVQGYEK | 0.000 | 0.000 | 0.000 | 0.034 | 0.038 | 0.000 | 0.915 | 0.014 | ||
| 2 spectra, FNTPALK | 0.000 | 0.046 | 0.000 | 0.000 | 0.061 | 0.074 | 0.819 | 0.000 | ||
| 3 spectra, MSSSEEESK | 0.000 | 0.001 | 0.000 | 0.047 | 0.071 | 0.000 | 0.881 | 0.000 | ||
| 3 spectra, NSVEVALNK | 0.221 | 0.029 | 0.012 | 0.000 | 0.052 | 0.000 | 0.686 | 0.000 | ||
| 3 spectra, DFAAEVVHPGDLK | 0.000 | 0.000 | 0.000 | 0.000 | 0.000 | 0.000 | 1.000 | 0.000 | ||
| 2 spectra, LASAAYPDPSK | 0.069 | 0.000 | 0.000 | 0.000 | 0.048 | 0.000 | 0.883 | 0.000 | ||
| 3 spectra, VDAQFGGIDQR | 0.000 | 0.036 | 0.000 | 0.000 | 0.108 | 0.000 | 0.856 | 0.000 | ||
| 8 spectra, ISDDCVAQWK | 0.000 | 0.000 | 0.000 | 0.063 | 0.000 | 0.000 | 0.886 | 0.051 | ||
| 7 spectra, HVLFPLK | 0.000 | 0.000 | 0.000 | 0.075 | 0.000 | 0.078 | 0.846 | 0.000 | ||
| 2 spectra, IFTFAEK | 0.000 | 0.000 | 0.116 | 0.046 | 0.062 | 0.000 | 0.776 | 0.000 | ||
| 2 spectra, LGFVSCK | 0.000 | 0.000 | 0.000 | 0.015 | 0.000 | 0.000 | 0.933 | 0.052 | ||
| 4 spectra, IADFLK | 0.000 | 0.000 | 0.000 | 0.000 | 0.010 | 0.000 | 0.990 | 0.000 | ||
| 2 spectra, LHLITR | 0.000 | 0.000 | 0.000 | 0.000 | 0.062 | 0.010 | 0.928 | 0.000 | ||
| 2 spectra, LLDPIR | 0.000 | 0.000 | 0.000 | 0.000 | 0.006 | 0.000 | 0.994 | 0.000 | ||
| 3 spectra, GQPDEELKPK | 0.000 | 0.000 | 0.000 | 0.000 | 0.062 | 0.000 | 0.938 | 0.000 | ||
| 4 spectra, NLQEVLGEEK | 0.000 | 0.003 | 0.000 | 0.091 | 0.057 | 0.000 | 0.848 | 0.000 | ||
| 5 spectra, SSEPEEIIPSR | 0.000 | 0.000 | 0.000 | 0.018 | 0.000 | 0.087 | 0.895 | 0.000 | ||
| 5 spectra, APWELLELR | 0.000 | 0.000 | 0.000 | 0.000 | 0.042 | 0.000 | 0.958 | 0.000 | ||
| 1 spectrum, TYTIYQELEK | 0.000 | 0.000 | 0.000 | 0.000 | 0.000 | 0.000 | 0.998 | 0.002 | ||
| 3 spectra, AMLESIGVPLEK | 0.000 | 0.000 | 0.000 | 0.053 | 0.000 | 0.000 | 0.947 | 0.000 | ||
| 2 spectra, AFCEPGNVENNGVLSFVK | 0.000 | 0.000 | 0.000 | 0.000 | 0.000 | 0.000 | 0.948 | 0.052 | ||
| 1 spectrum, LSSLVTQHDAK | 0.000 | 0.053 | 0.246 | 0.000 | 0.000 | 0.000 | 0.701 | 0.000 | ||
| 2 spectra, GTDYQLSK | 0.000 | 0.000 | 0.000 | 0.031 | 0.000 | 0.000 | 0.914 | 0.055 |
| Plot | Mito | Lyso or Perox | ER | Golgi | PM | Cytosol | Nucleus | ||||||
| Expt B |
10 peptides |
23 spectra |
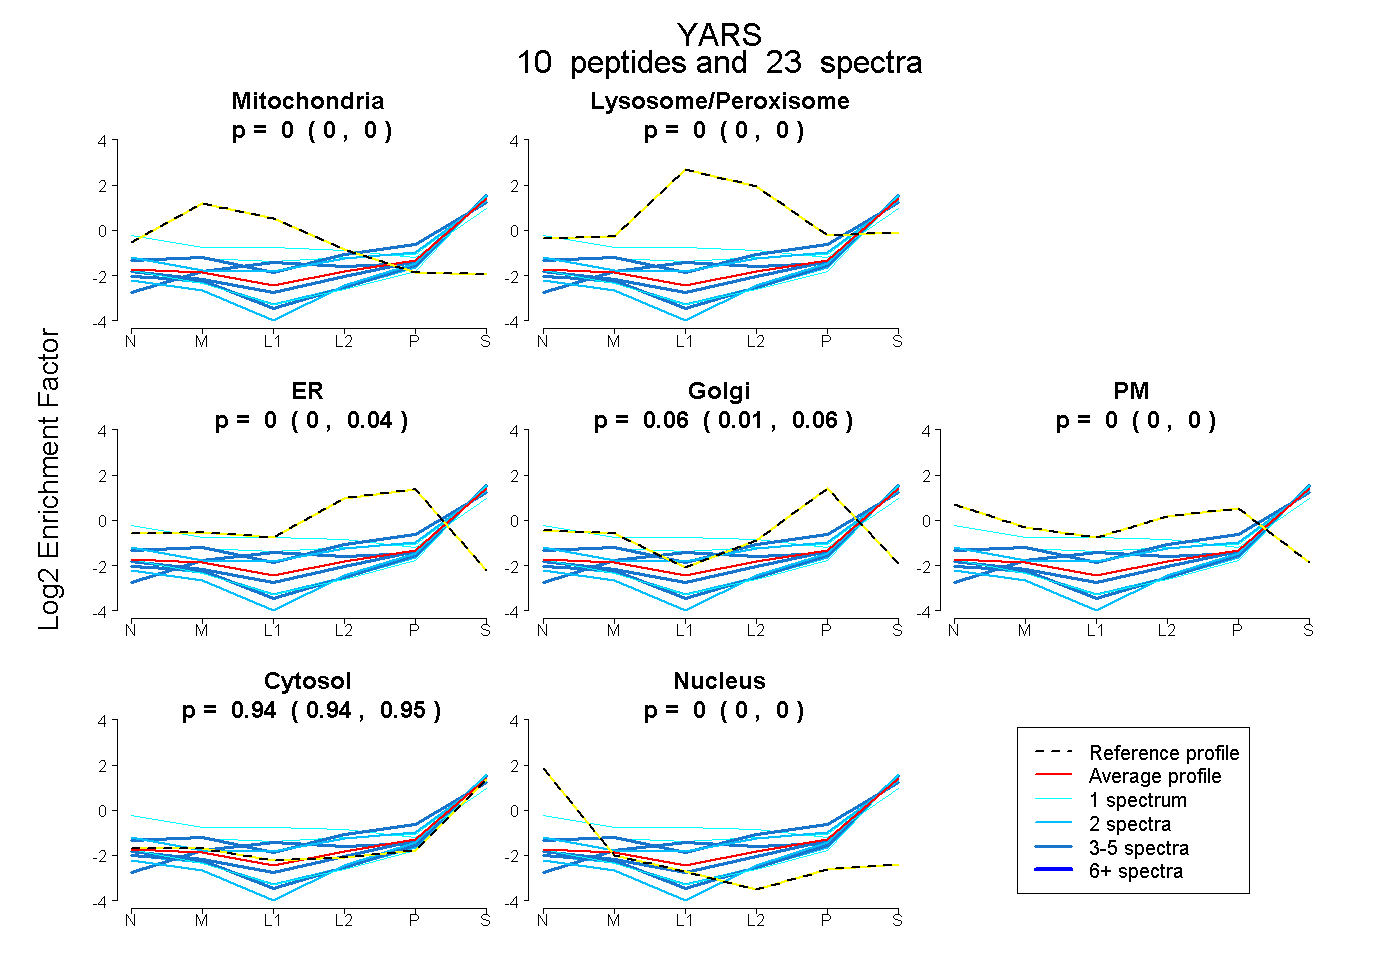 |
0.000 0.000 | 0.000 |
0.000 0.000 | 0.000 |
0.000 0.000 | 0.038 |
0.055 0.008 | 0.061 |
0.000 0.000 | 0.000 |
0.945 0.937 | 0.954 |
0.000 0.000 | 0.000 |
|||
| Plot | Lyso | Other | |||||||||||
| Expt C |
24 peptides |
107 spectra |
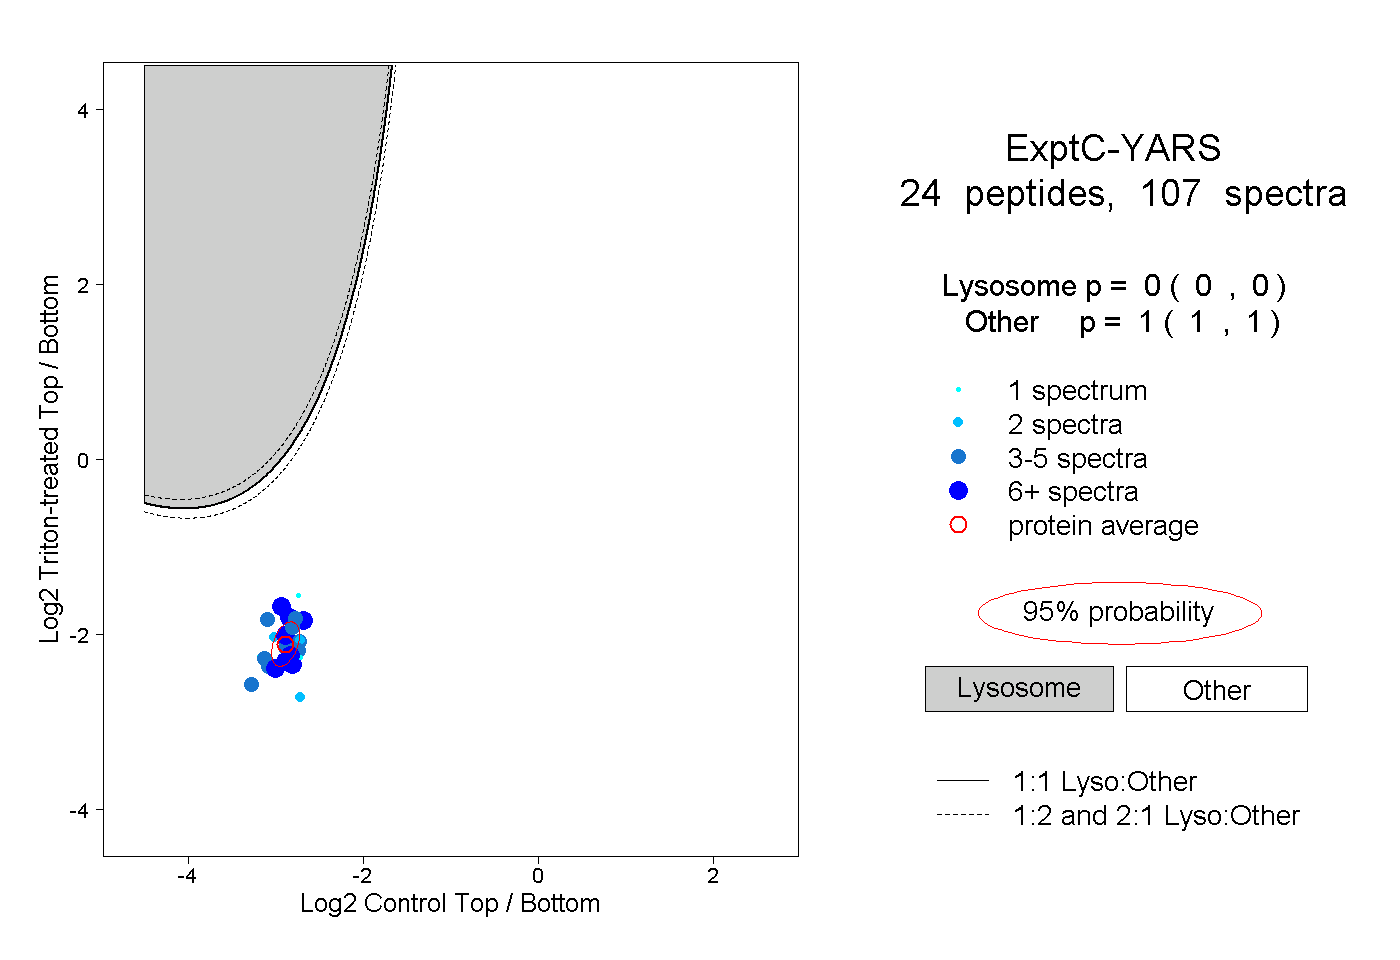 |
0.000 0.000 | 0.000 |
1.000 1.000 | 1.000 |
||||||||
| Plot | Lyso | Other | |||||||||||
| Expt D |
6 peptides |
13 spectra |
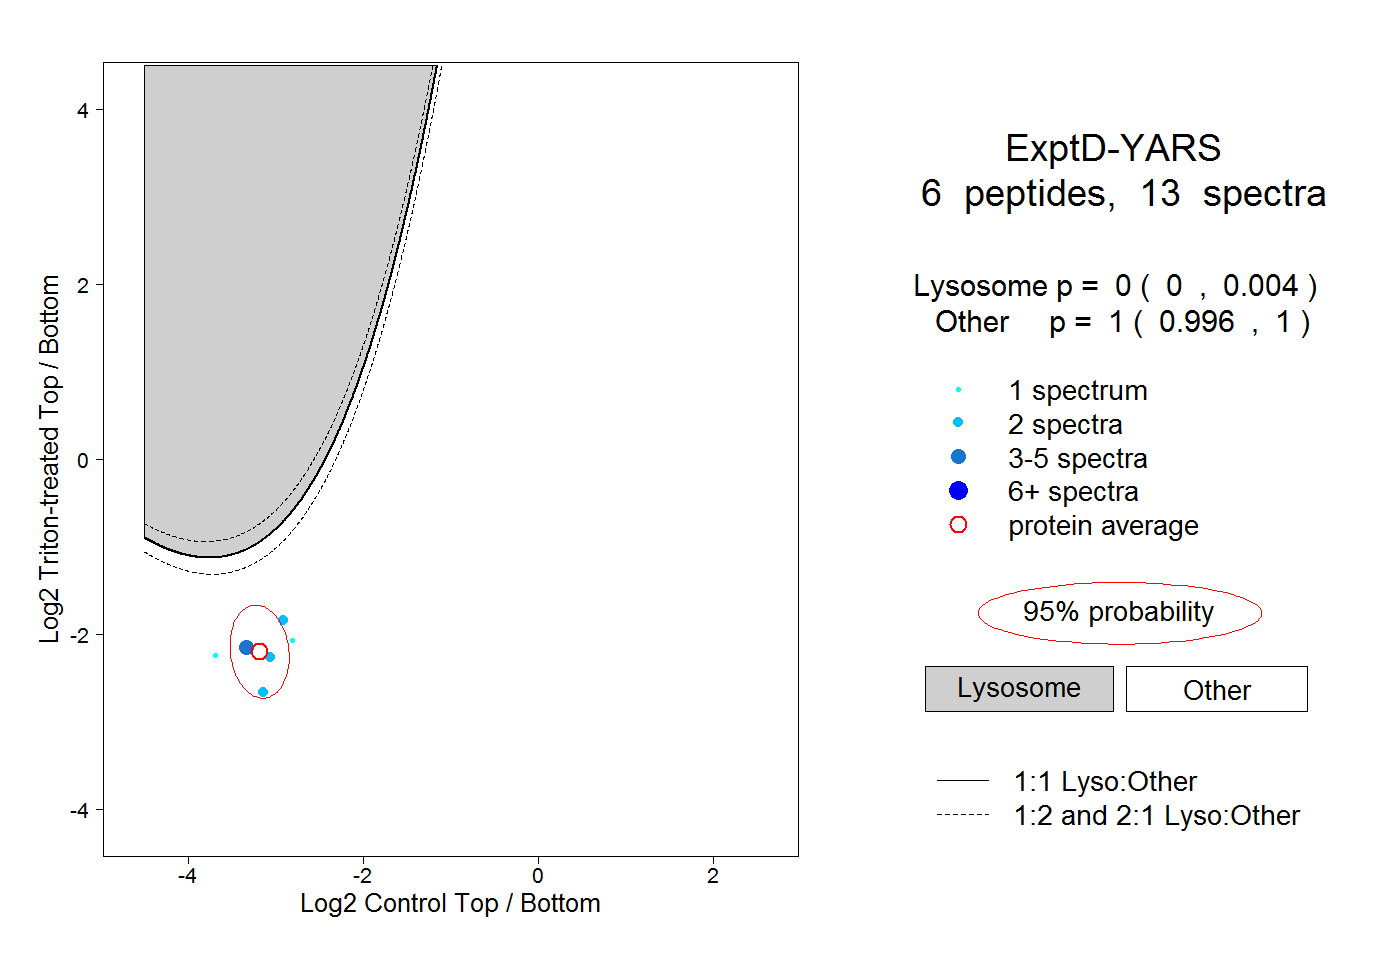 |
0.000 0.000 | 0.004 |
1.000 0.996 | 1.000 |