KRT7
[ENSRNOP00000010660]
Main page
| | | Plot |
Mito |
Lyso |
|
Perox |
ER |
Golgi |
PM |
Cytosol |
Nucleus |
|
| Expt A |
 7
7
peptides |
12
spectra |
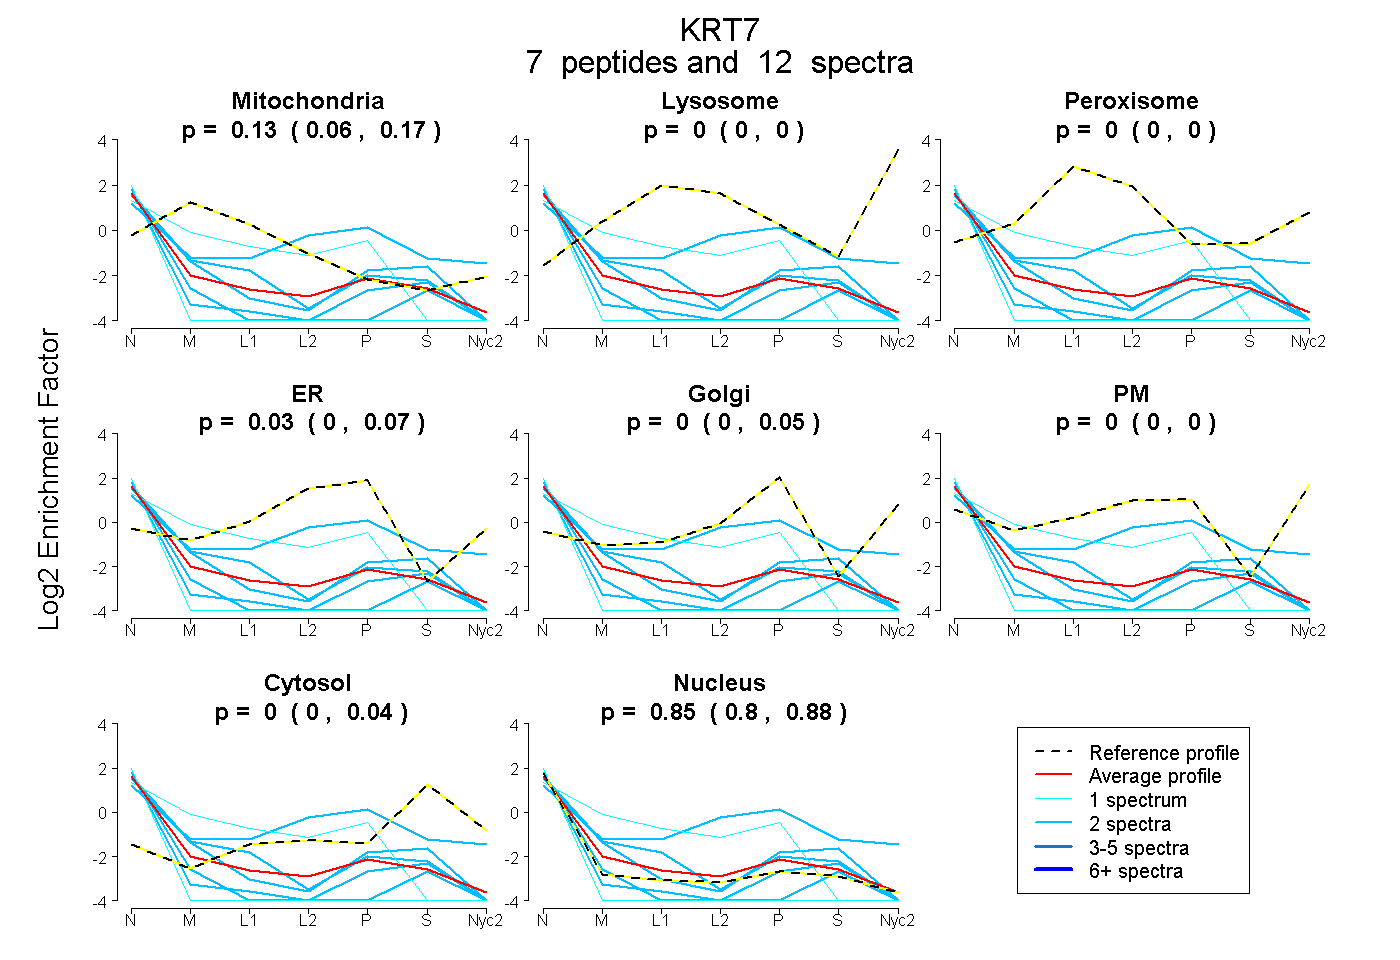 |
0.127
0.059 | 0.172 |
0.000
0.000 | 0.000 |
|
0.000
0.000 | 0.000 |
0.026
0.000 | 0.066 |
0.001
0.000 | 0.048 |
0.000
0.000 | 0.000 |
0.001
0.000 | 0.036 |
0.846
0.800 | 0.879 |
|
| | | Plot |
Mito |
|
Lyso or Perox |
|
ER |
Golgi |
PM |
Cytosol |
Nucleus |
|
| Expt B |
3
peptides |
4
spectra |
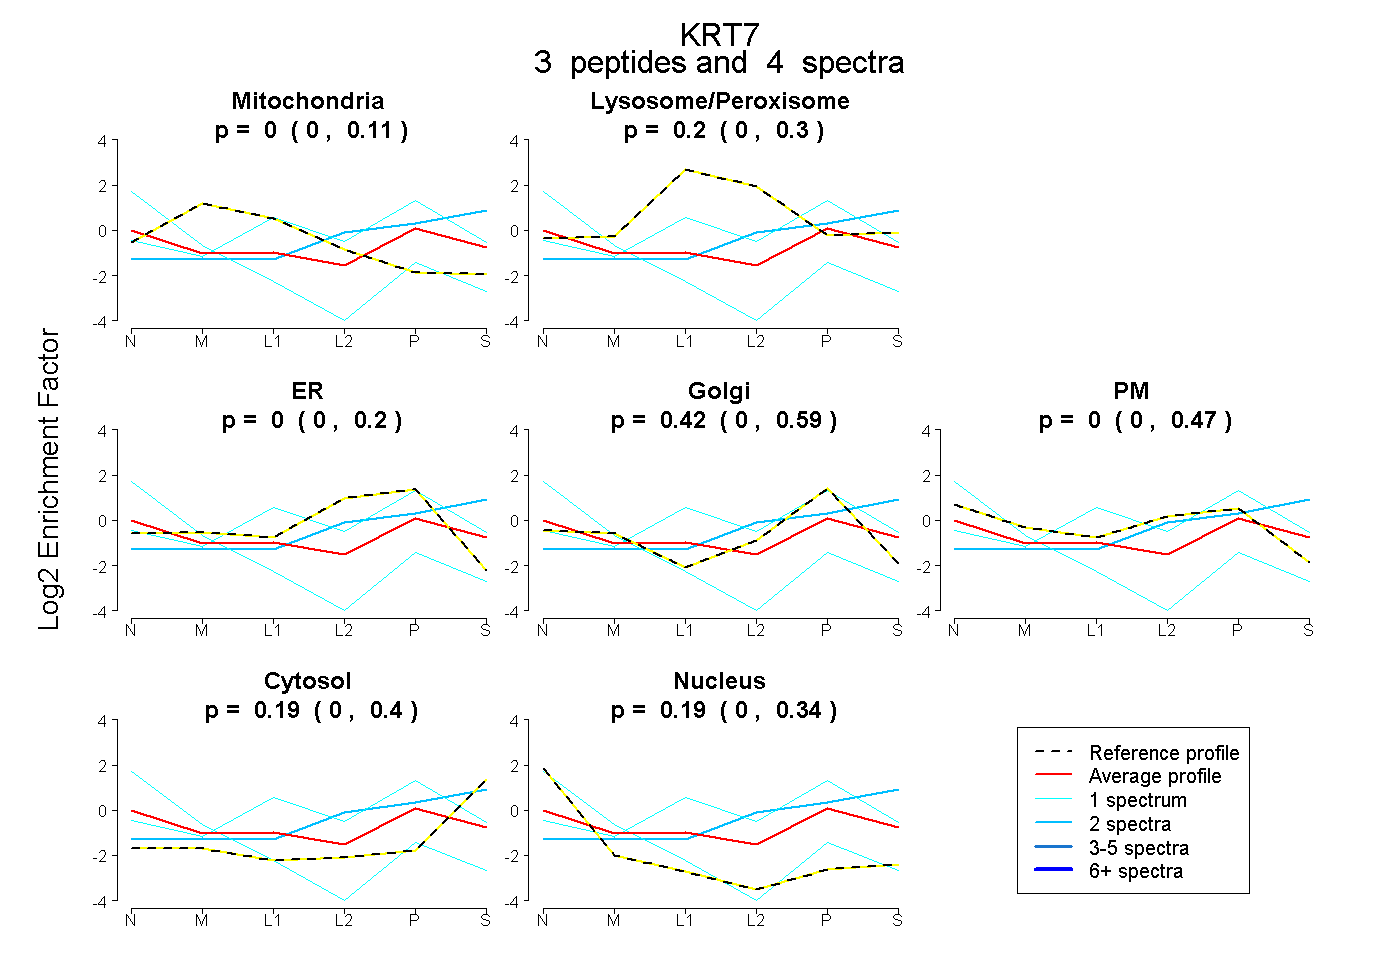 |
0.000
0.000 | 0.114 |
|
0.197
0.000 | 0.296 |
|
0.000
0.000 | 0.198 |
0.422
0.000 | 0.594 |
0.000
0.000 | 0.466 |
0.189
0.000 | 0.398 |
0.192
0.000 | 0.338 |
|
| 1 spectrum, SLDLDGIIADVK |
0.071 |
|
0.000 |
|
0.000 |
0.137 |
0.000 |
0.000 |
0.792 |
|
| 2 spectra, AGFGSR |
0.000 |
|
0.146 |
|
0.323 |
0.000 |
0.000 |
0.531 |
0.000 |
|
| 1 spectrum, SMQDVVEDFK |
0.000 |
|
0.428 |
|
0.000 |
0.500 |
0.000 |
0.072 |
0.000 |
|