 7
7peptides
spectra
0.059 | 0.172
0.000 | 0.000
0.000 | 0.000
0.000 | 0.066
0.000 | 0.048
0.000 | 0.000
0.000 | 0.036
0.800 | 0.879
| Plot | Mito | Lyso | Perox | ER | Golgi | PM | Cytosol | Nucleus | |||||
| Expt A |
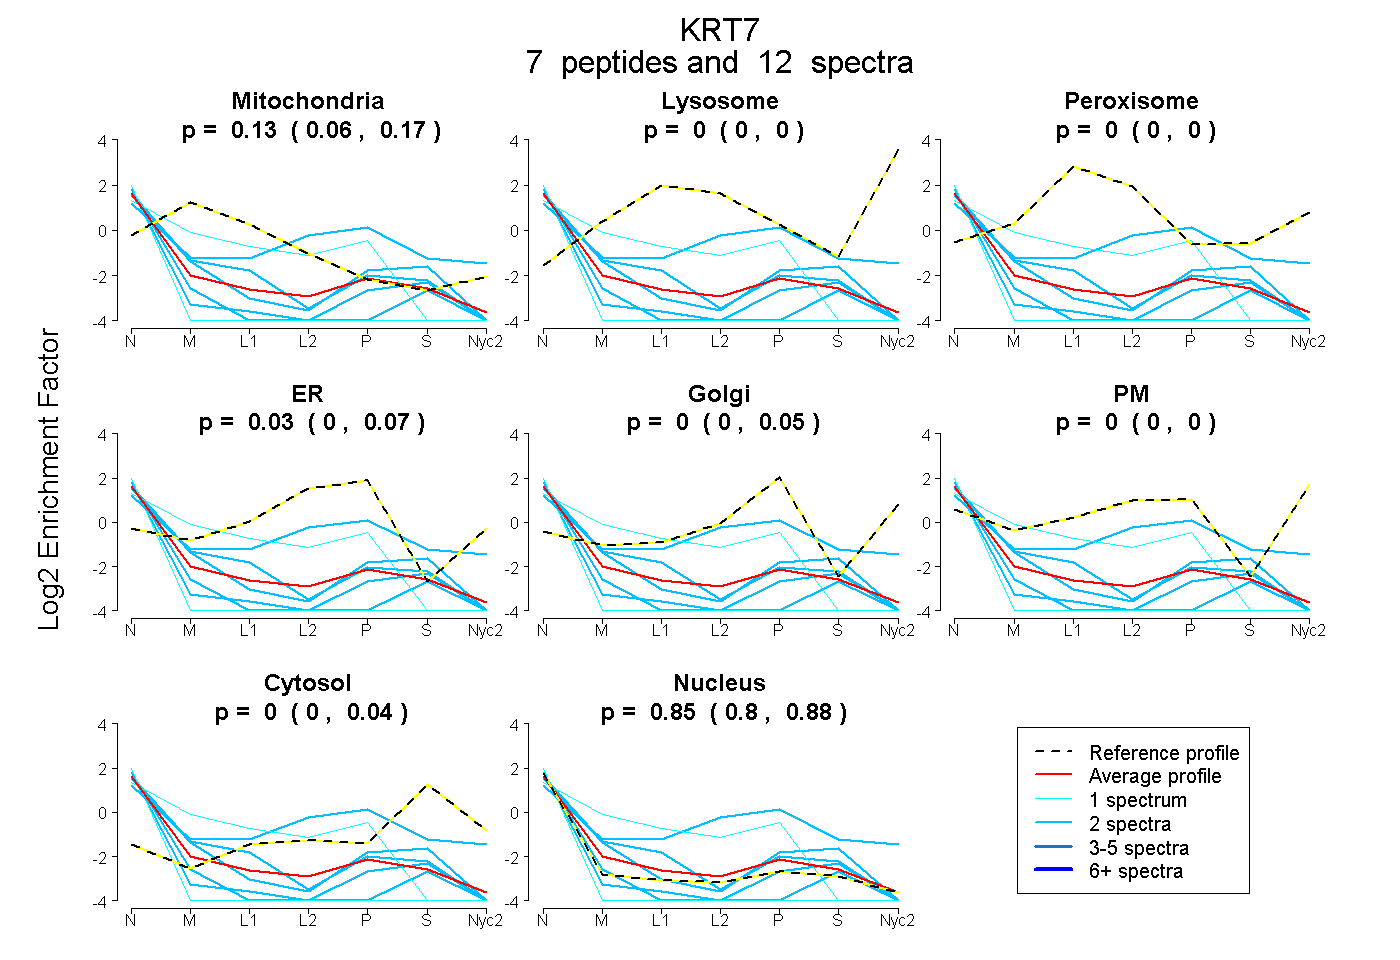
7 peptides |
12 spectra |
|
0.127 0.059 | 0.172 |
0.000 0.000 | 0.000 |
0.000 0.000 | 0.000 |
0.026 0.000 | 0.066 |
0.001 0.000 | 0.048 |
0.000 0.000 | 0.000 |
0.001 0.000 | 0.036 |
0.846 0.800 | 0.879 |
| 2 spectra, QQLEALQLDGGR | 0.252 | 0.000 | 0.000 | 0.000 | 0.000 | 0.000 | 0.000 | 0.748 | ||
| 2 spectra, SLYGLGTSRPR | 0.000 | 0.000 | 0.046 | 0.355 | 0.000 | 0.129 | 0.151 | 0.318 | ||
| 2 spectra, LAEVEEALQK | 0.000 | 0.000 | 0.000 | 0.000 | 0.000 | 0.000 | 0.000 | 1.000 | ||
| 1 spectrum, SLDLDGIIADVK | 0.000 | 0.000 | 0.000 | 0.000 | 0.000 | 0.000 | 0.000 | 1.000 | ||
| 2 spectra, SAYGGPVGAGIR | 0.000 | 0.000 | 0.000 | 0.000 | 0.000 | 0.000 | 0.000 | 1.000 | ||
| 1 spectrum, TAAENEFVLLK | 0.395 | 0.000 | 0.000 | 0.219 | 0.000 | 0.000 | 0.000 | 0.386 | ||
| 2 spectra, SMQDVVEDFK | 0.097 | 0.000 | 0.000 | 0.000 | 0.000 | 0.000 | 0.082 | 0.821 |
| Plot | Mito | Lyso or Perox | ER | Golgi | PM | Cytosol | Nucleus | ||||||
| Expt B |
3 peptides |
4 spectra |
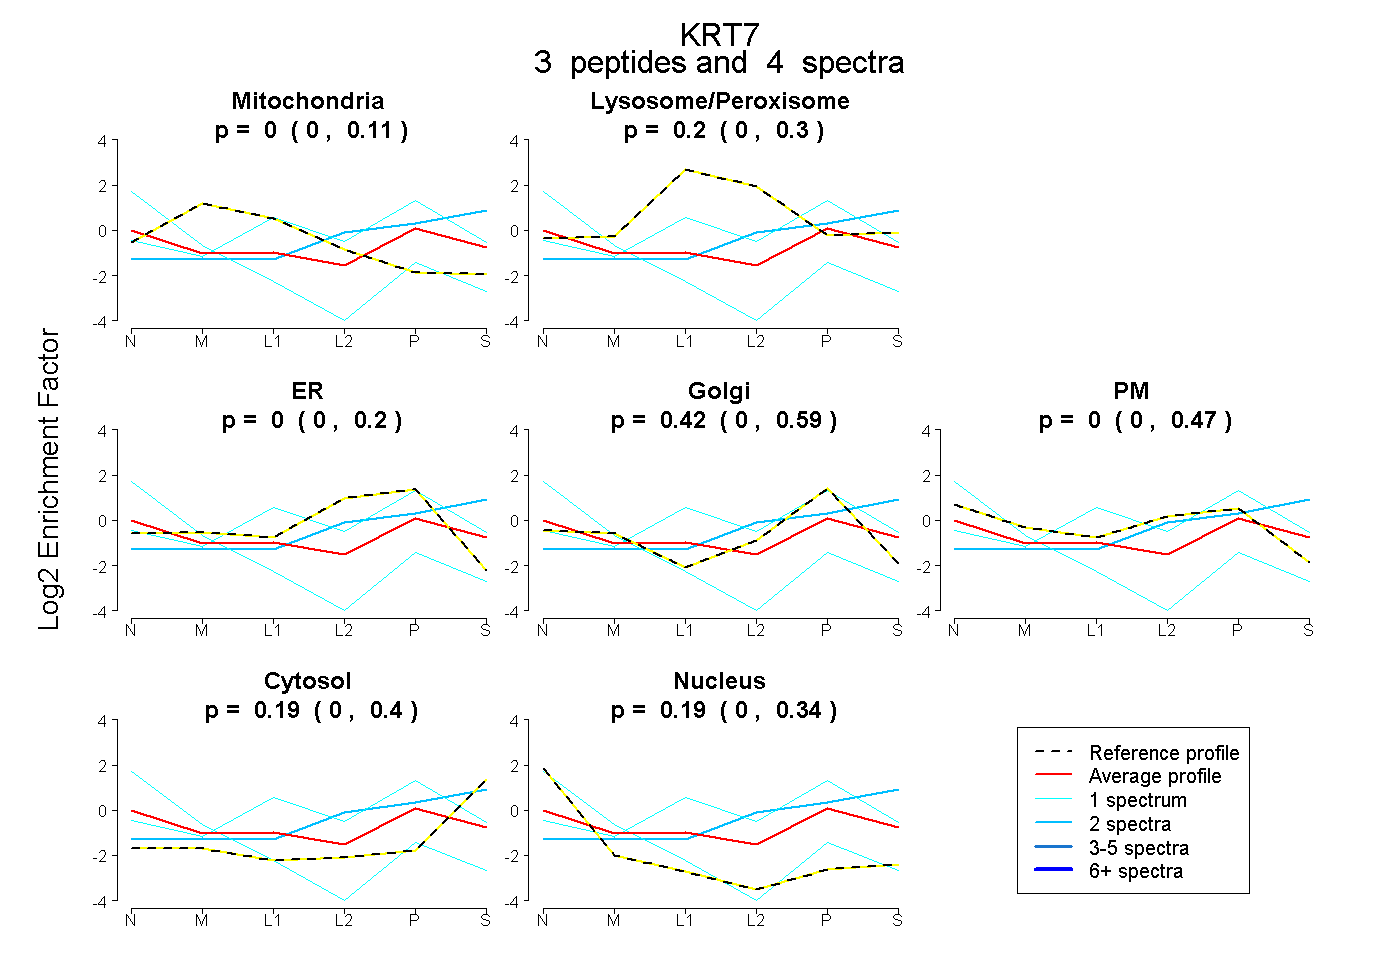 |
0.000 0.000 | 0.114 |
0.197 0.000 | 0.296 |
0.000 0.000 | 0.198 |
0.422 0.000 | 0.594 |
0.000 0.000 | 0.466 |
0.189 0.000 | 0.398 |
0.192 0.000 | 0.338 |