 15
15peptides
spectra
0.000 | 0.000
0.000 | 0.000
0.000 | 0.000
0.000 | 0.000
0.000 | 0.000
0.000 | 0.000
0.958 | 0.965
0.034 | 0.041
| Plot | Mito | Lyso | Perox | ER | Golgi | PM | Cytosol | Nucleus | |||||
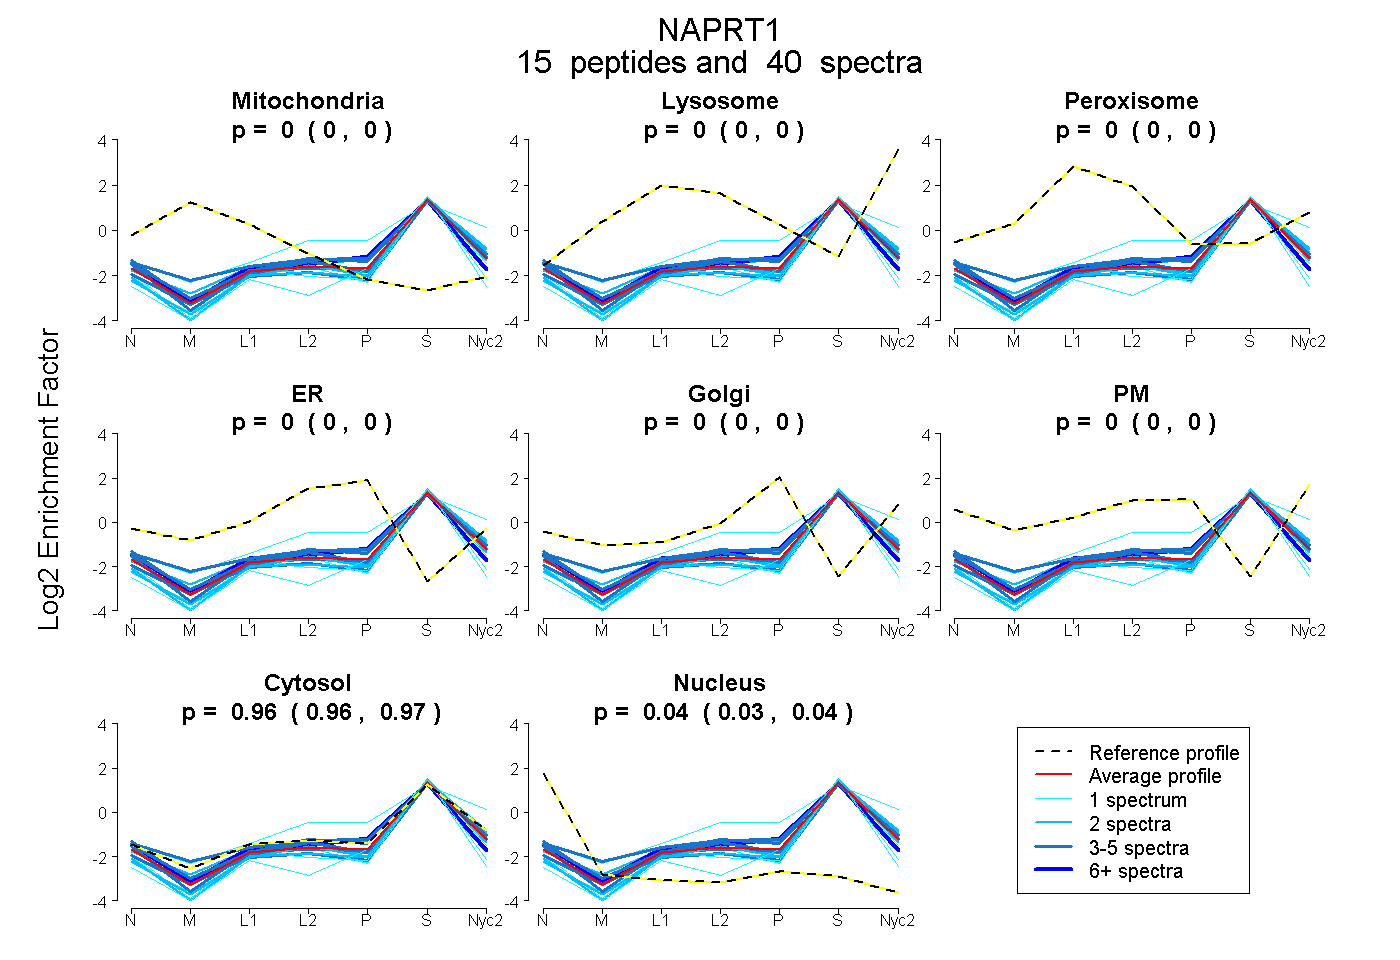
| Expt A |
15 peptides |
40 spectra |
|
0.000 0.000 | 0.000 |
0.000 0.000 | 0.000 |
0.000 0.000 | 0.000 |
0.000 0.000 | 0.000 |
0.000 0.000 | 0.000 |
0.000 0.000 | 0.000 |
0.962 0.958 | 0.965 |
0.038 0.034 | 0.041 |
| 4 spectra, EPHPGER | 0.000 | 0.000 | 0.000 | 0.000 | 0.000 | 0.000 | 1.000 | 0.000 | ||
| 1 spectrum, ALVDSLSAR | 0.000 | 0.000 | 0.000 | 0.000 | 0.000 | 0.000 | 0.944 | 0.056 | ||
| 1 spectrum, ACEEAEFELFFR | 0.000 | 0.000 | 0.000 | 0.000 | 0.000 | 0.000 | 0.958 | 0.042 | ||
| 4 spectra, ILPGSK | 0.000 | 0.000 | 0.000 | 0.000 | 0.000 | 0.000 | 0.948 | 0.052 | ||
| 2 spectra, LLEMGLR | 0.000 | 0.000 | 0.000 | 0.000 | 0.000 | 0.000 | 1.000 | 0.000 | ||
| 1 spectrum, LIAGPDK | 0.000 | 0.112 | 0.000 | 0.000 | 0.088 | 0.000 | 0.800 | 0.000 | ||
| 3 spectra, LRPAHK | 0.000 | 0.000 | 0.000 | 0.000 | 0.000 | 0.000 | 0.973 | 0.027 | ||
| 2 spectra, QLQNPAVYQVALSEK | 0.000 | 0.000 | 0.000 | 0.000 | 0.000 | 0.000 | 0.961 | 0.039 | ||
| 2 spectra, AGQELR | 0.000 | 0.000 | 0.000 | 0.000 | 0.000 | 0.000 | 0.983 | 0.017 | ||
| 8 spectra, ALDCSR | 0.000 | 0.000 | 0.000 | 0.000 | 0.000 | 0.000 | 0.935 | 0.065 | ||
| 4 spectra, AFAQQSLSR | 0.000 | 0.000 | 0.000 | 0.000 | 0.000 | 0.000 | 0.898 | 0.102 | ||
| 2 spectra, AFQGLLDSYSVR | 0.000 | 0.000 | 0.000 | 0.000 | 0.000 | 0.000 | 1.000 | 0.000 | ||
| 1 spectrum, GSEVNVIGIGTNVVTCPK | 0.000 | 0.000 | 0.000 | 0.000 | 0.000 | 0.000 | 0.928 | 0.072 | ||
| 4 spectra, LVSVGGQPR | 0.030 | 0.000 | 0.000 | 0.000 | 0.000 | 0.000 | 0.968 | 0.002 | ||
| 1 spectrum, QPSMGCVYK | 0.000 | 0.000 | 0.000 | 0.000 | 0.000 | 0.000 | 0.881 | 0.119 |
| Plot | Mito | Lyso or Perox | ER | Golgi | PM | Cytosol | Nucleus | ||||||
| Expt B |
8 peptides |
10 spectra |
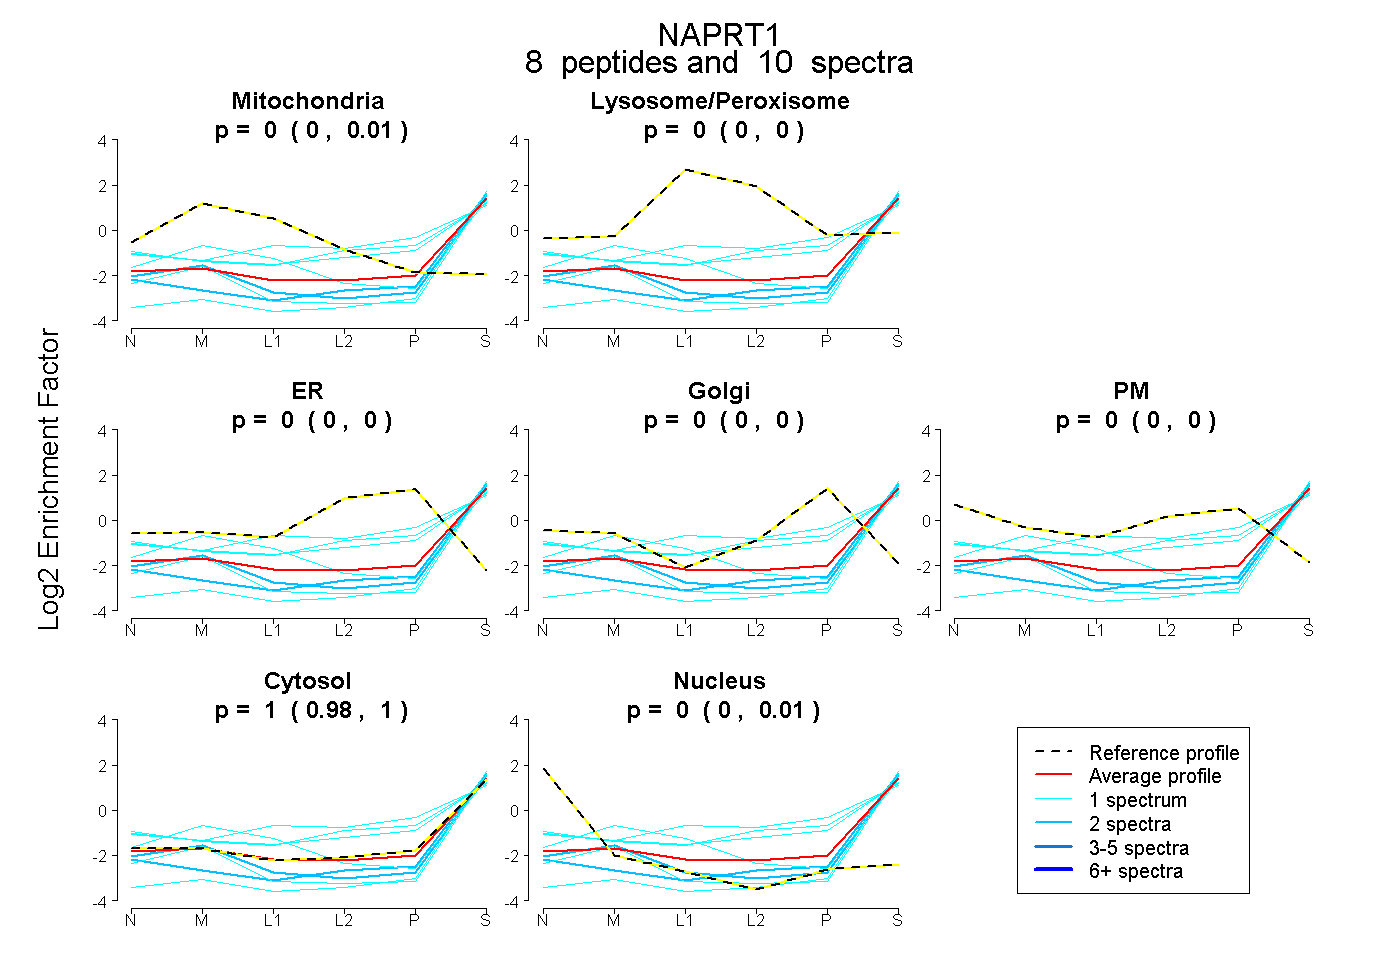 |
0.000 0.000 | 0.008 |
0.000 0.000 | 0.004 |
0.000 0.000 | 0.000 |
0.000 0.000 | 0.000 |
0.000 0.000 | 0.000 |
1.000 0.977 | 1.000 |
0.000 0.000 | 0.012 |
|||
| Plot | Lyso | Other | |||||||||||
| Expt C |
14 peptides |
33 spectra |
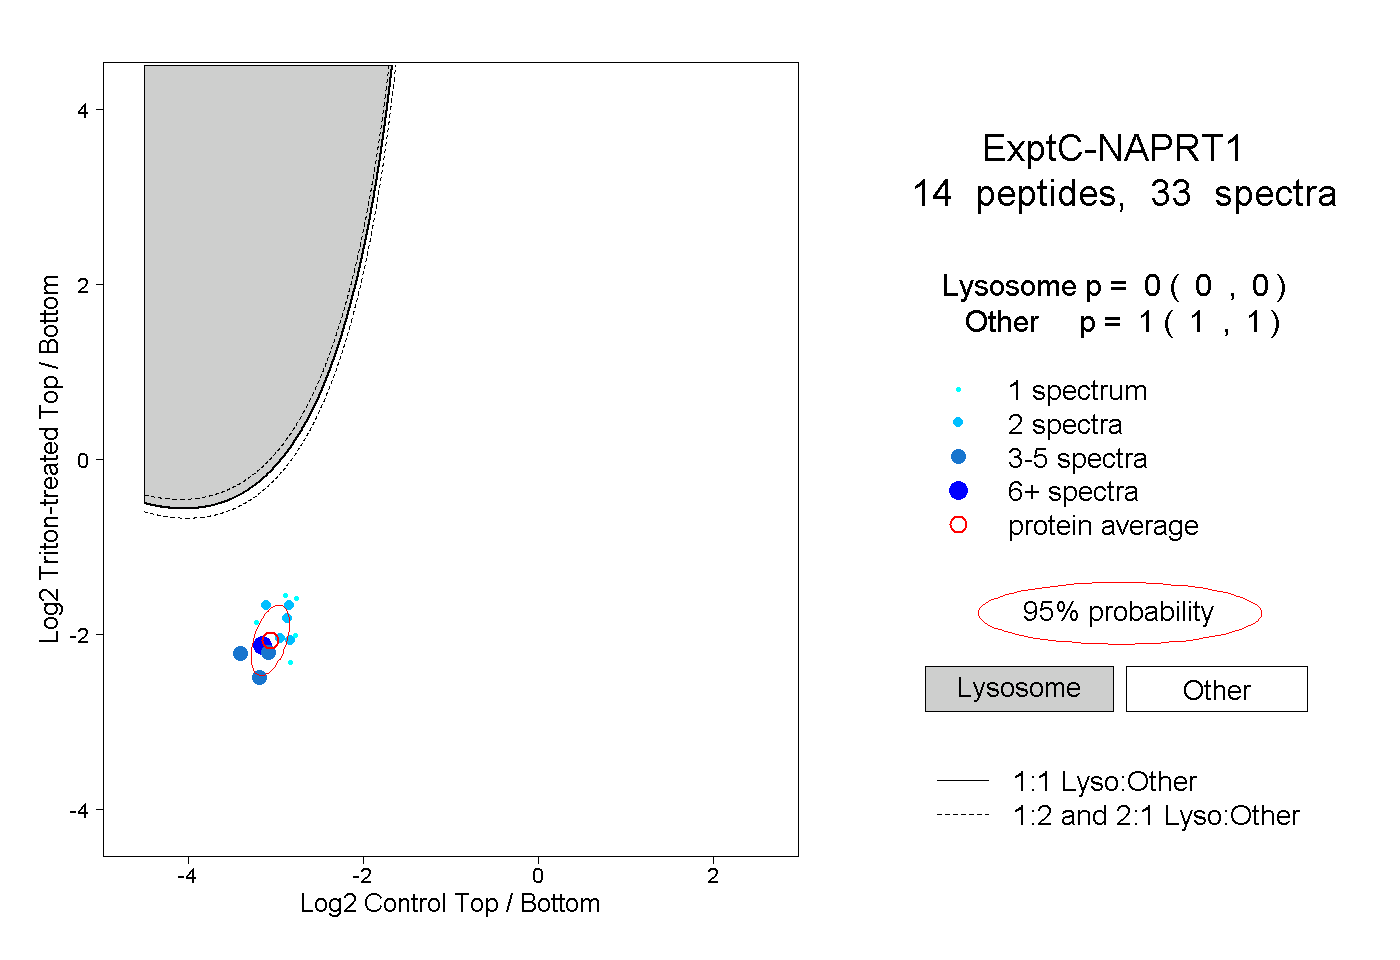 |
0.000 0.000 | 0.000 |
1.000 1.000 | 1.000 |
||||||||
| Plot | Lyso | Other | |||||||||||
| Expt D |
4 peptides |
6 spectra |
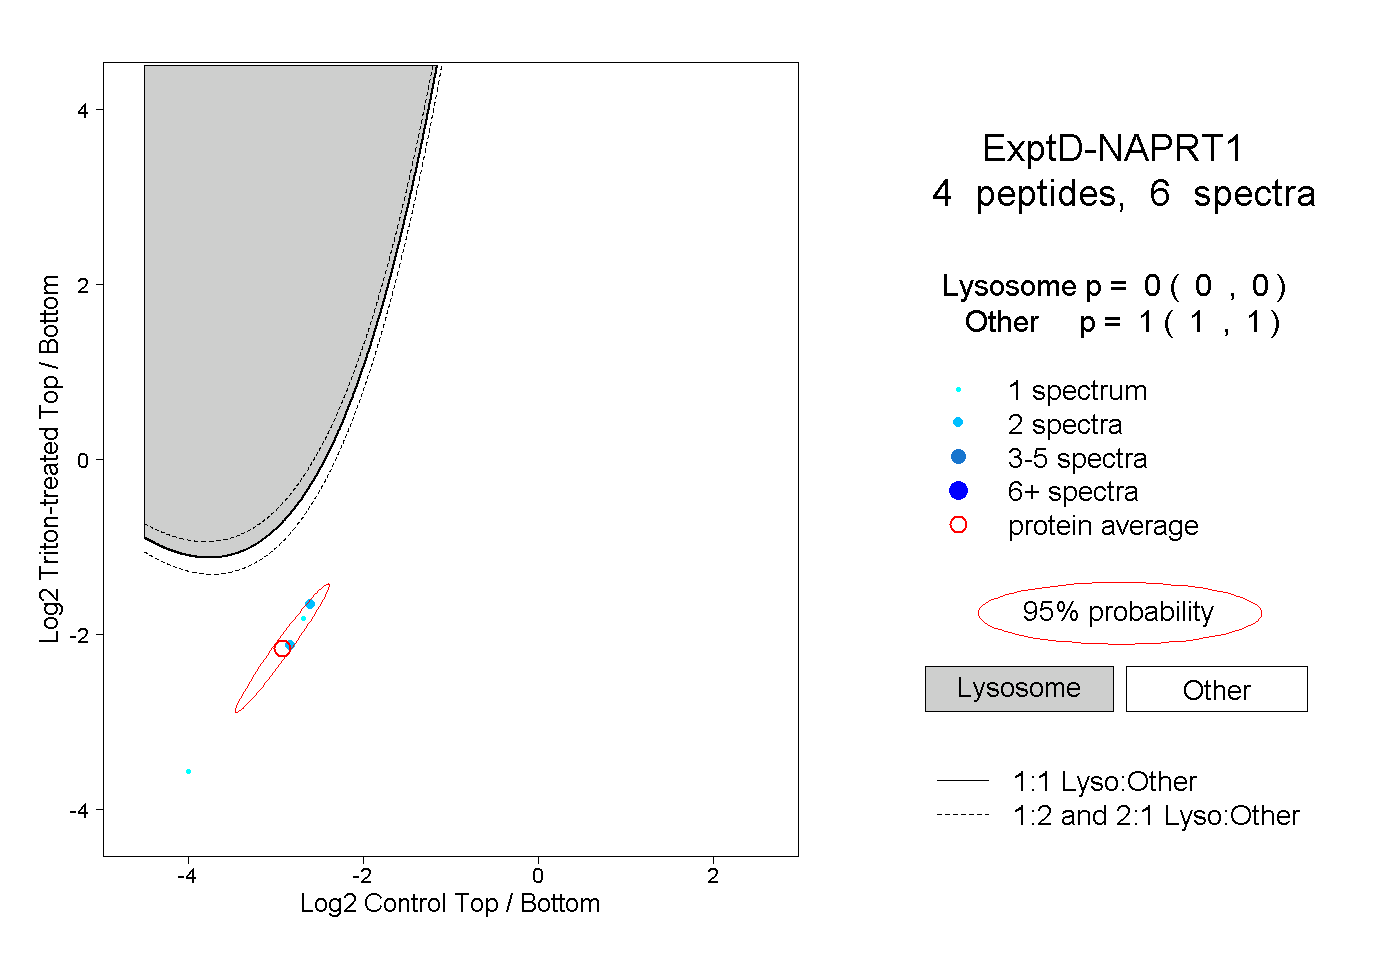 |
0.000 0.000 | 0.000 |
1.000 1.000 | 1.000 |