STAU1
[ENSRNOP00000010633]
Main page
| | | Plot |
Mito |
Lyso |
|
Perox |
ER |
Golgi |
PM |
Cytosol |
Nucleus |
|
| Expt A |
 16
16
peptides |
39
spectra |
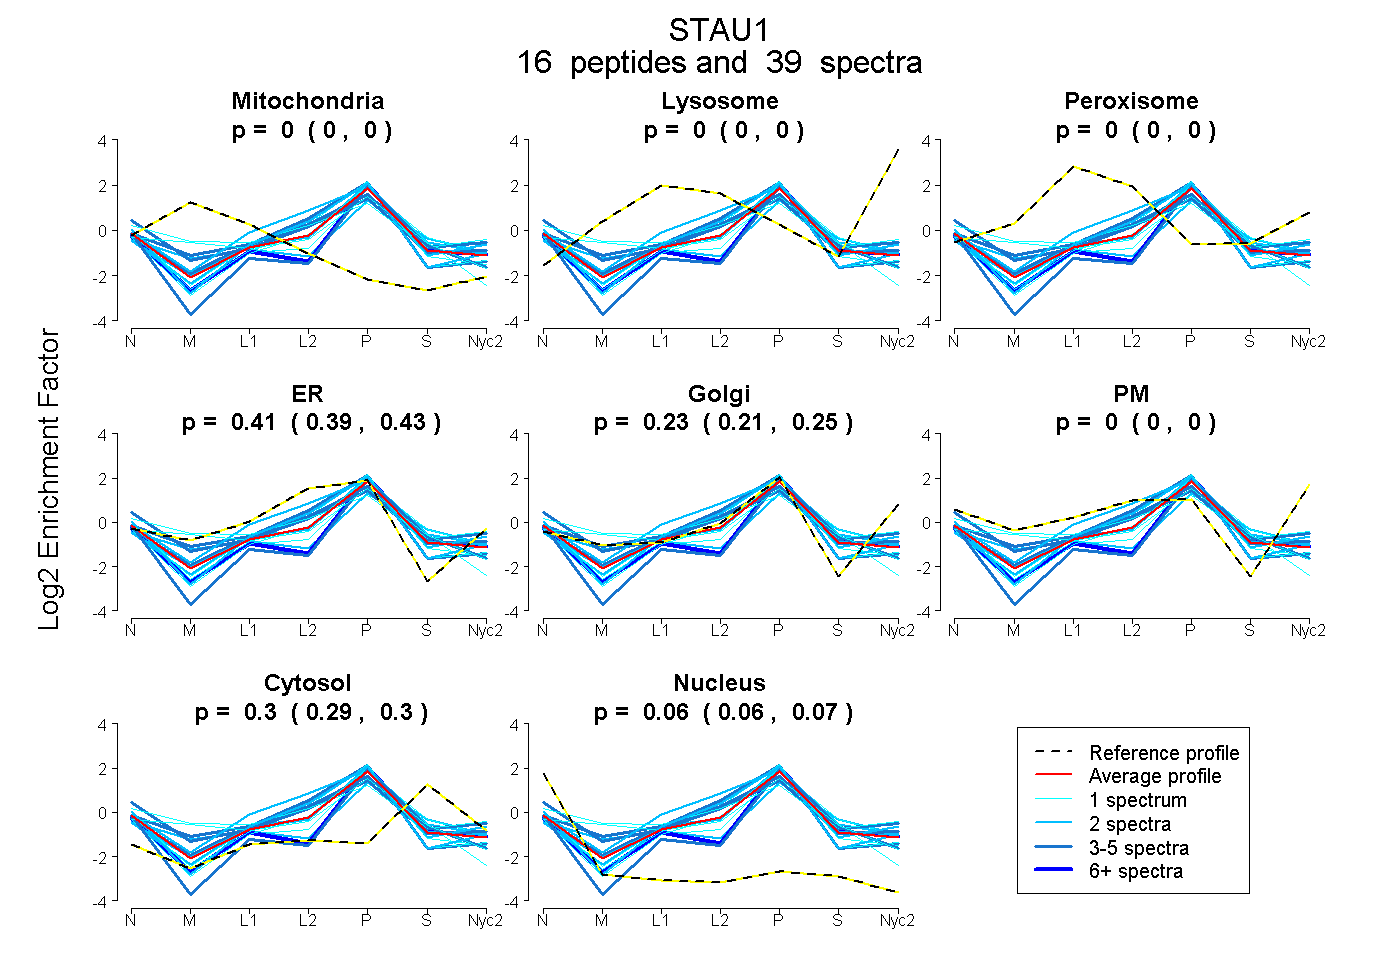 |
0.000
0.000 | 0.000 |
0.000
0.000 | 0.000 |
|
0.000
0.000 | 0.000 |
0.410
0.391 | 0.428 |
0.229
0.208 | 0.246 |
0.000
0.000 | 0.000 |
0.296
0.290 | 0.301 |
0.064
0.060 | 0.068 |
|
| | | Plot |
Mito |
|
Lyso or Perox |
|
ER |
Golgi |
PM |
Cytosol |
Nucleus |
|
| Expt B |
7
peptides |
12
spectra |
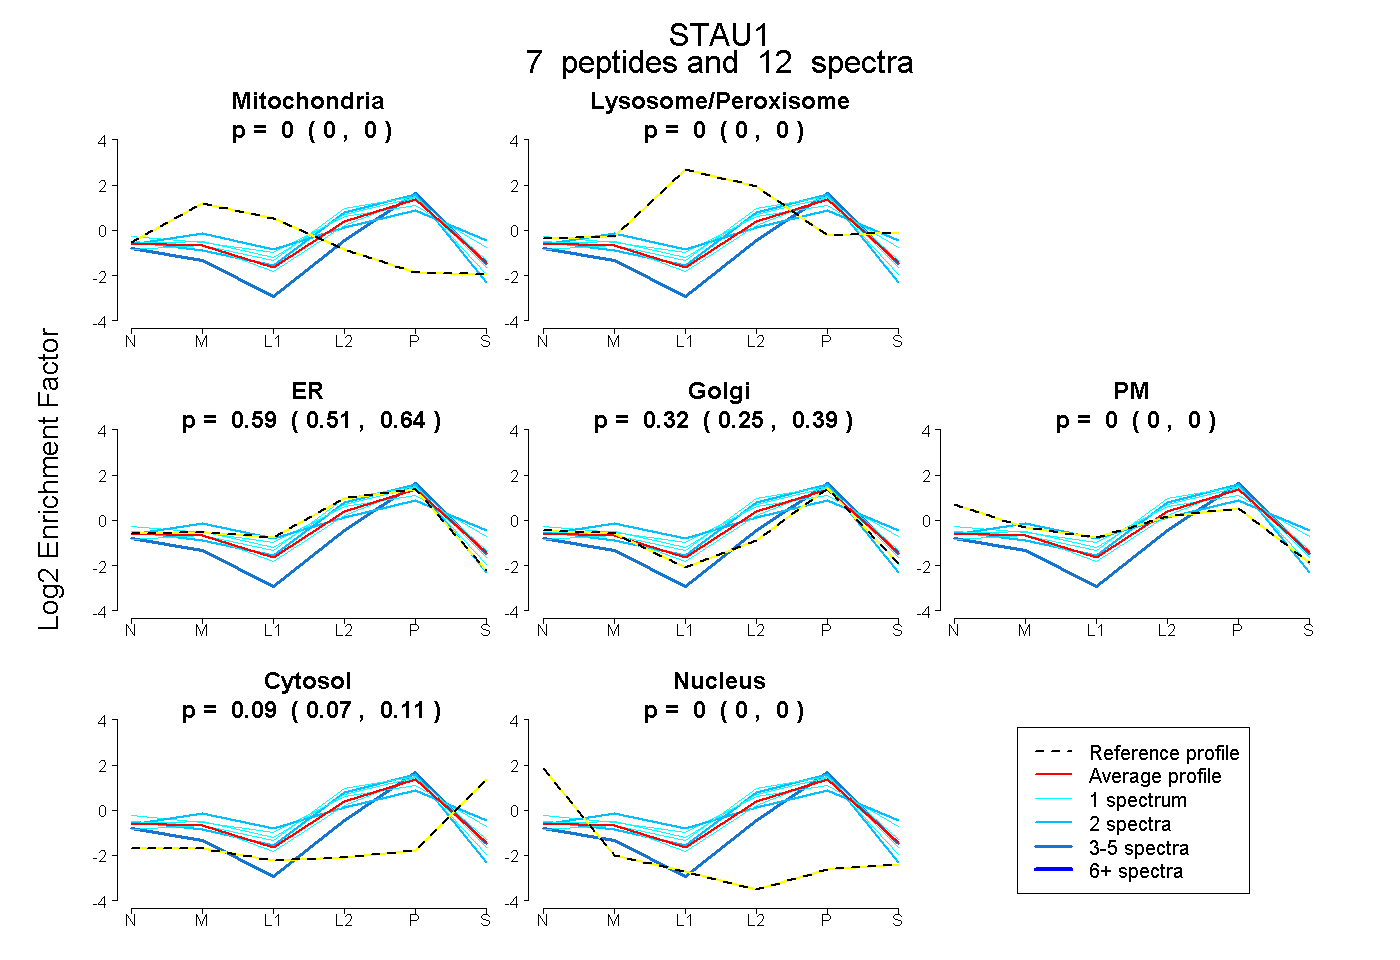 |
0.000
0.000 | 0.000 |
|
0.000
0.000 | 0.000 |
|
0.586
0.514 | 0.639 |
0.323
0.250 | 0.390 |
0.000
0.000 | 0.000 |
0.091
0.068 | 0.110 |
0.000
0.000 | 0.000 |
|
| | | Plot |
|
Lyso |
|
|
|
|
|
|
|
Other |
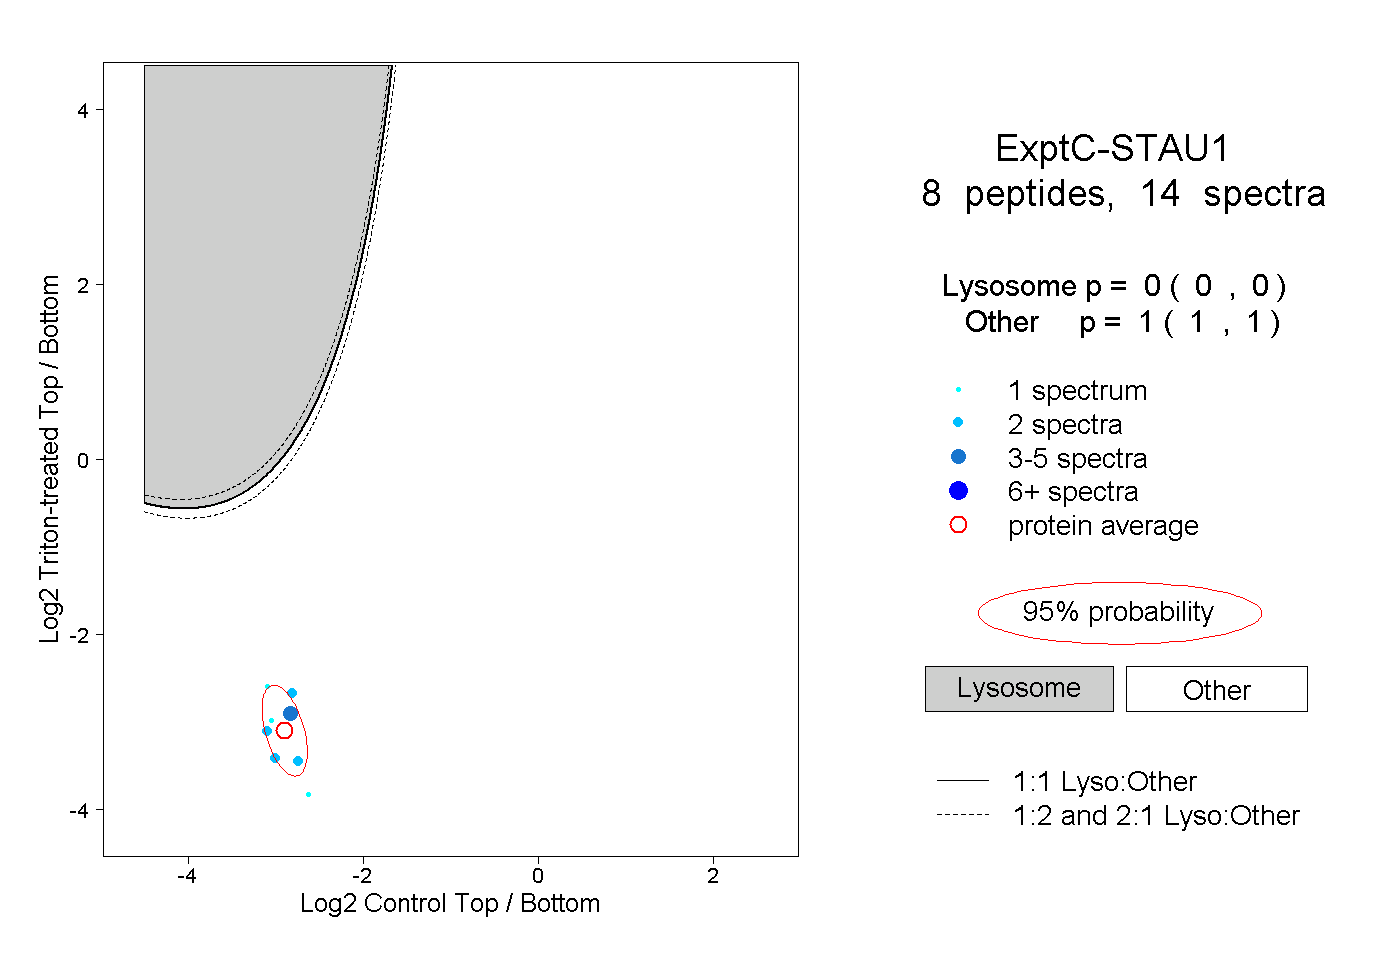
| Expt C |
8
peptides |
14
spectra |
 |
|
0.000
0.000 | 0.000 |
|
|
|
|
|
|
|
1.000
1.000 | 1.000 |
| 2 spectra, LAQIQQAK |
|
0.000 |
|
|
|
|
|
|
|
1.000 |
| 2 spectra, TLQSEPLPER |
|
0.000 |
|
|
|
|
|
|
|
1.000 |
| 3 spectra, AVLEQLR |
|
0.000 |
|
|
|
|
|
|
|
1.000 |
| 2 spectra, AAPNPAK |
|
0.000 |
|
|
|
|
|
|
|
1.000 |
| 1 spectrum, ESGPPHMK |
|
0.000 |
|
|
|
|
|
|
|
1.000 |
| 1 spectrum, SQPTCK |
|
0.000 |
|
|
|
|
|
|
|
1.000 |
| 1 spectrum, TRPSEQLYYLSR |
|
0.000 |
|
|
|
|
|
|
|
1.000 |
| 2 spectra, ESEEENLNK |
|
0.000 |
|
|
|
|
|
|
|
1.000 |
| | | Plot |
|
Lyso |
|
|
|
|
|
|
|
Other |
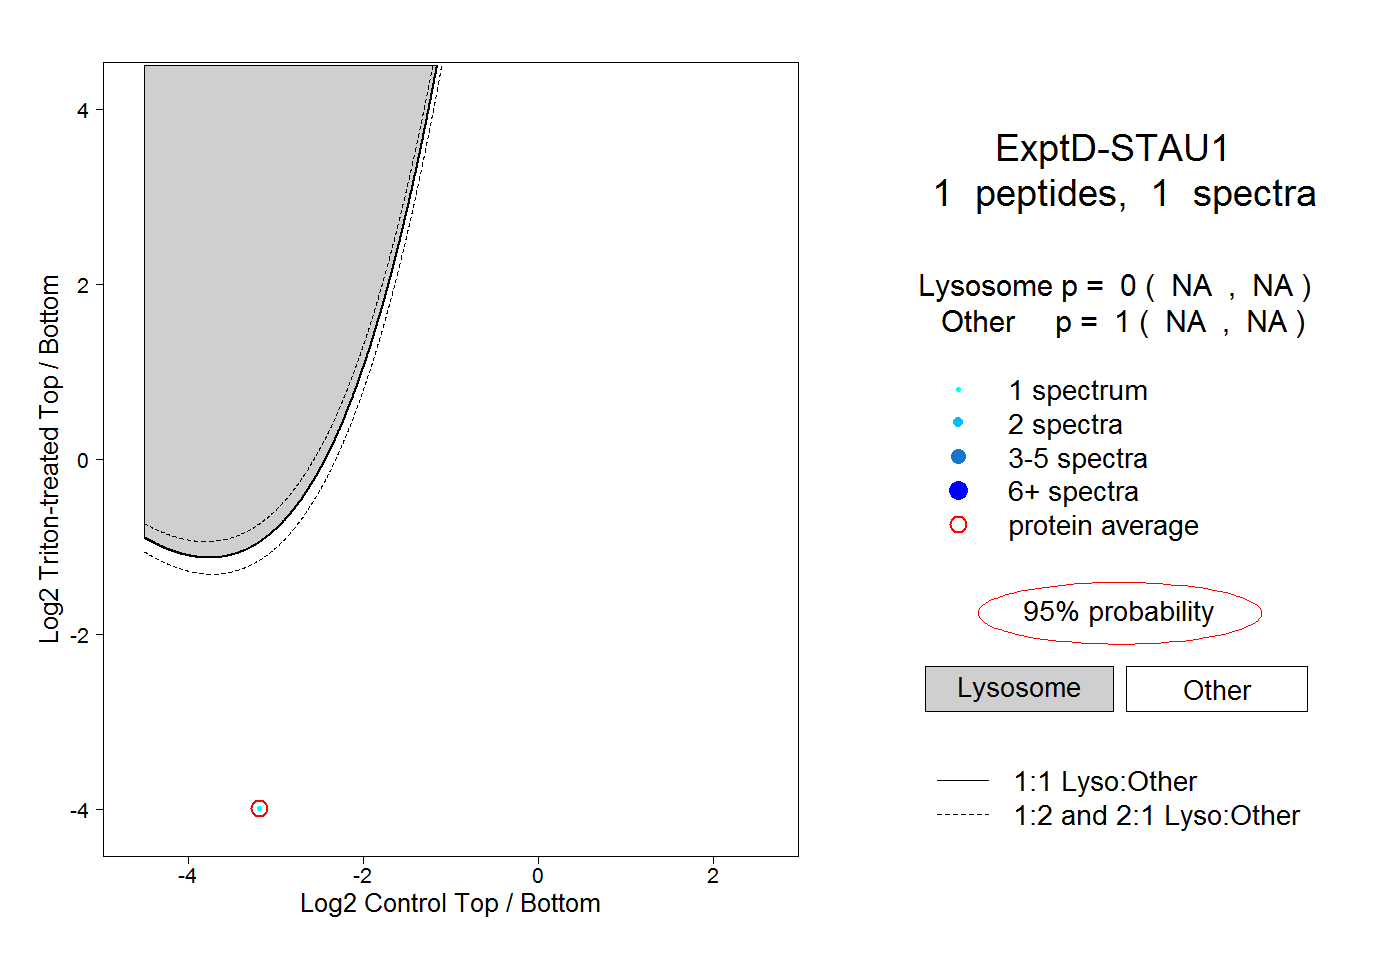
| Expt D |
1
peptide |
1
spectrum |
 |
|
0.000
NA | NA |
|
|
|
|
|
|
|
1.000
NA | NA |