16
16peptides
spectra
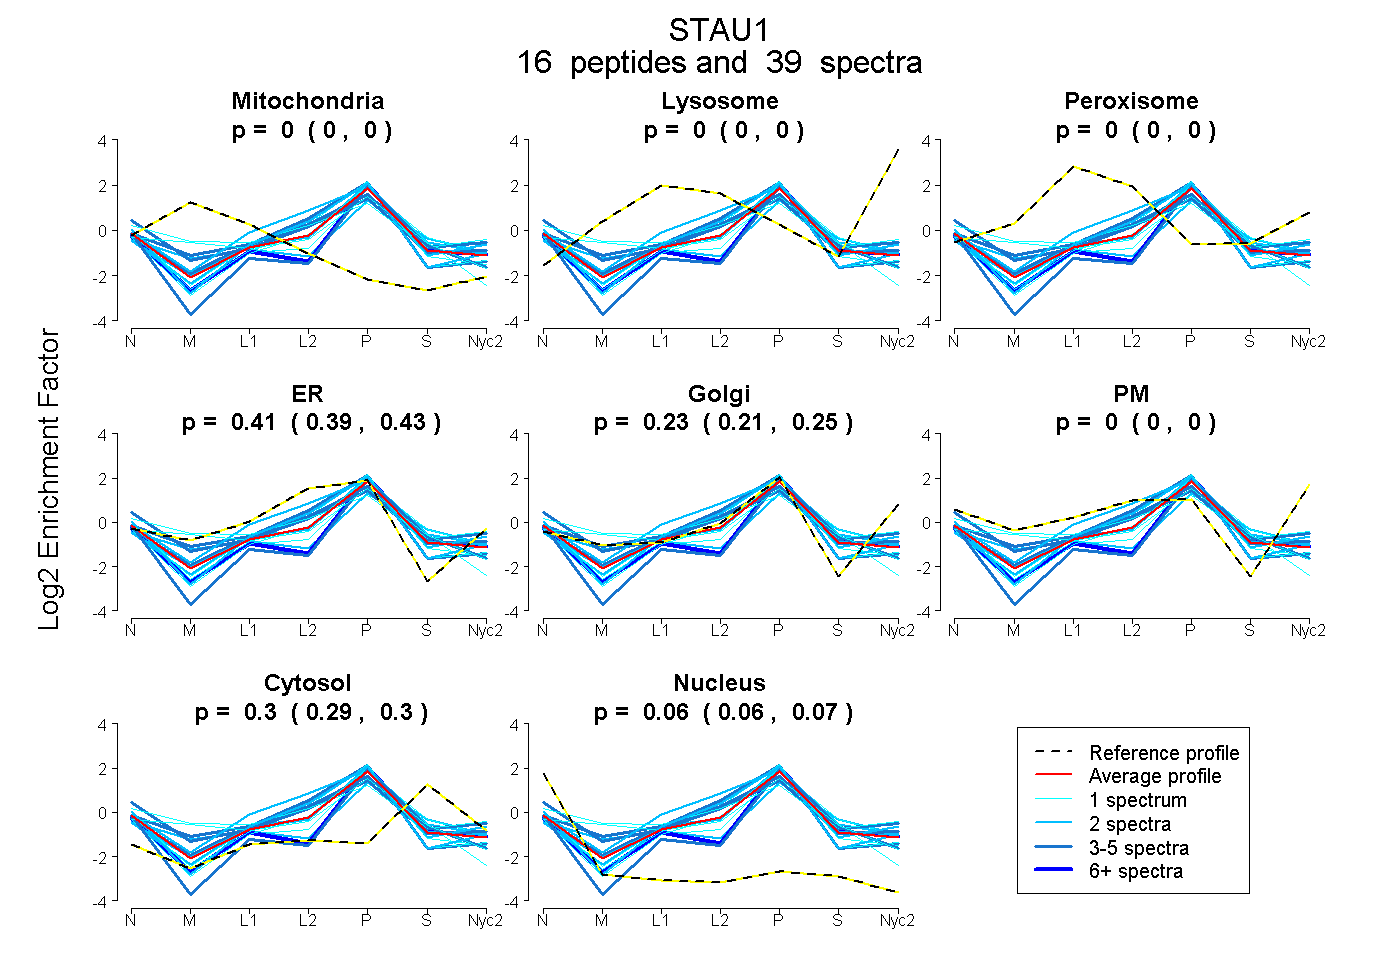
0.000 | 0.000
0.000 | 0.000
0.000 | 0.000
0.391 | 0.428
0.208 | 0.246
0.000 | 0.000
0.290 | 0.301
0.060 | 0.068
7peptides
spectra
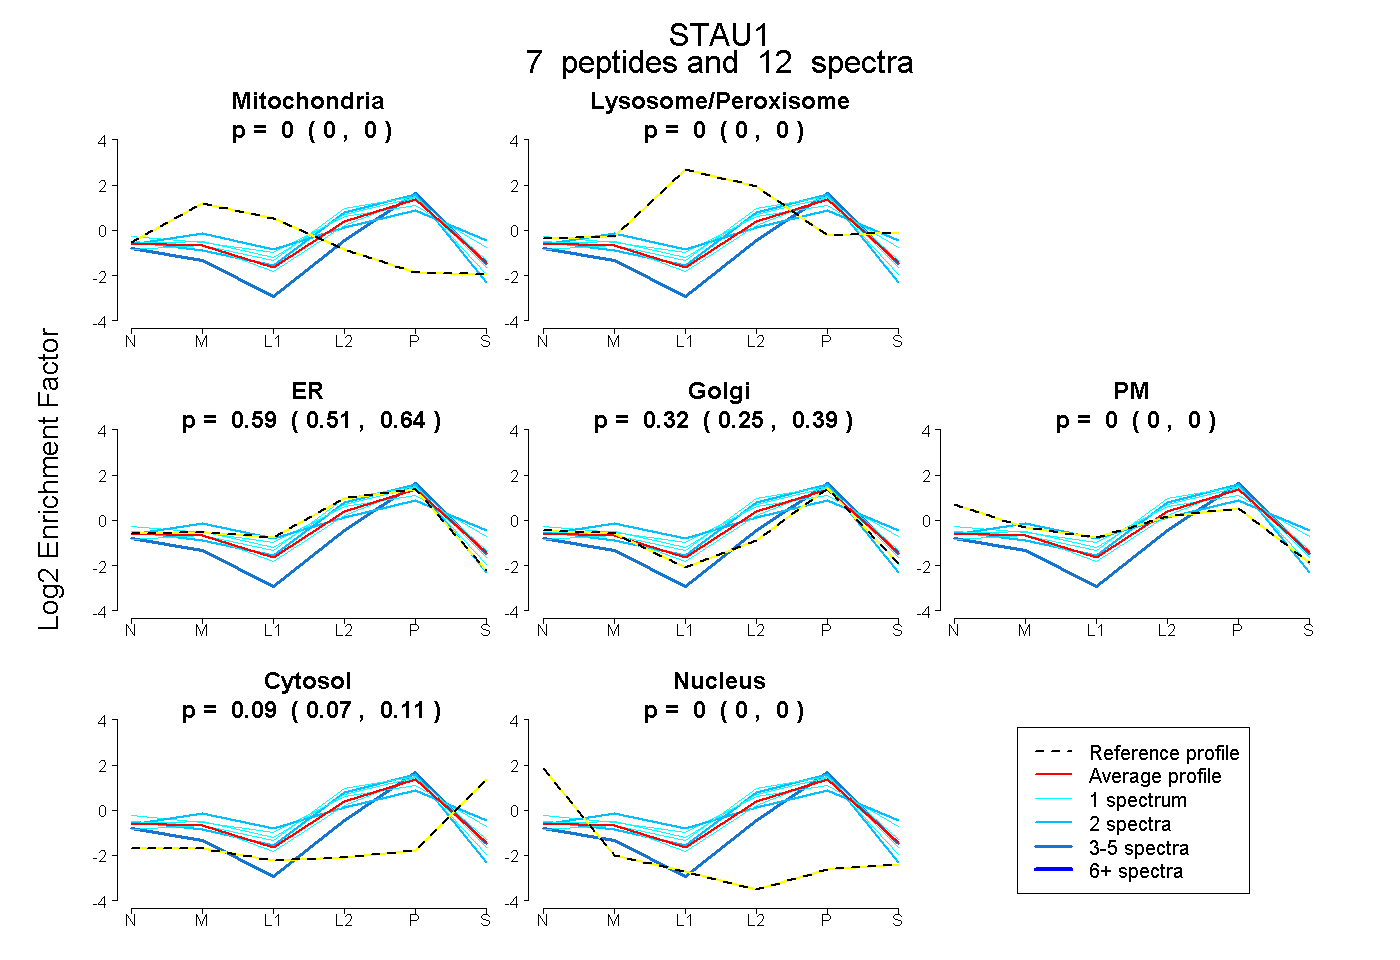
0.000 | 0.000
0.000 | 0.000
0.514 | 0.639
0.250 | 0.390
0.000 | 0.000
0.068 | 0.110
0.000 | 0.000