 16
16peptides
spectra
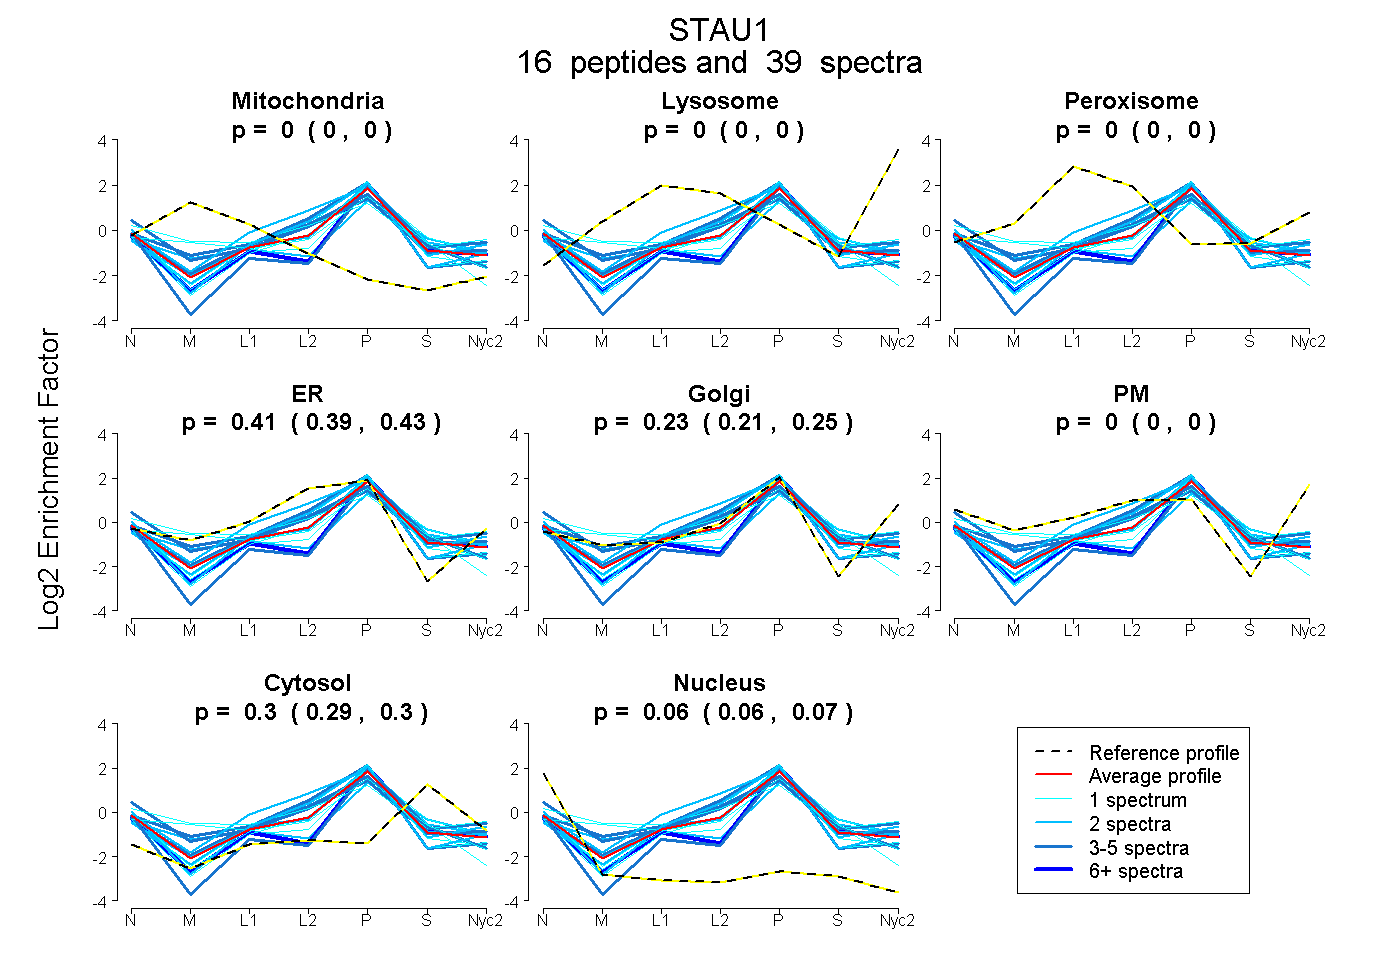
0.000 | 0.000
0.000 | 0.000
0.000 | 0.000
0.391 | 0.428
0.208 | 0.246
0.000 | 0.000
0.290 | 0.301
0.060 | 0.068
| Plot | Mito | Lyso | Perox | ER | Golgi | PM | Cytosol | Nucleus | |||||
| Expt A |
16 peptides |
39 spectra |
|
0.000 0.000 | 0.000 |
0.000 0.000 | 0.000 |
0.000 0.000 | 0.000 |
0.410 0.391 | 0.428 |
0.229 0.208 | 0.246 |
0.000 0.000 | 0.000 |
0.296 0.290 | 0.301 |
0.064 0.060 | 0.068 |
| 1 spectrum, MYKPVDPHSR | 0.054 | 0.000 | 0.011 | 0.374 | 0.146 | 0.140 | 0.275 | 0.000 | ||
| 2 spectra, AAPNPAK | 0.017 | 0.000 | 0.000 | 0.082 | 0.453 | 0.000 | 0.405 | 0.044 | ||
| 2 spectra, EFVMQVK | 0.000 | 0.000 | 0.000 | 0.348 | 0.317 | 0.000 | 0.312 | 0.023 | ||
| 2 spectra, EPEYMLLTER | 0.000 | 0.000 | 0.000 | 0.351 | 0.259 | 0.000 | 0.390 | 0.000 | ||
| 2 spectra, LPPLPAVER | 0.000 | 0.000 | 0.000 | 0.762 | 0.000 | 0.000 | 0.238 | 0.000 | ||
| 3 spectra, ESGPPHMK | 0.000 | 0.000 | 0.000 | 0.547 | 0.125 | 0.000 | 0.243 | 0.084 | ||
| 1 spectrum, TRPSEQLYYLSR | 0.073 | 0.000 | 0.000 | 0.475 | 0.083 | 0.000 | 0.324 | 0.045 | ||
| 1 spectrum, ESEEENLNK | 0.000 | 0.000 | 0.000 | 0.626 | 0.104 | 0.000 | 0.166 | 0.104 | ||
| 3 spectra, LAQIQQAK | 0.000 | 0.000 | 0.000 | 0.493 | 0.208 | 0.000 | 0.299 | 0.000 | ||
| 3 spectra, AVLEQLR | 0.000 | 0.000 | 0.000 | 0.745 | 0.004 | 0.000 | 0.171 | 0.080 | ||
| 4 spectra, TLQSEPLPER | 0.000 | 0.000 | 0.000 | 0.000 | 0.470 | 0.000 | 0.353 | 0.177 | ||
| 10 spectra, ATVTAMIAR | 0.000 | 0.000 | 0.000 | 0.000 | 0.593 | 0.000 | 0.296 | 0.111 | ||
| 1 spectrum, LQTAPDYGQGMNPISR | 0.000 | 0.000 | 0.000 | 0.485 | 0.149 | 0.000 | 0.234 | 0.132 | ||
| 2 spectra, VSVGEFVGEGEGK | 0.000 | 0.000 | 0.000 | 0.587 | 0.148 | 0.000 | 0.171 | 0.093 | ||
| 1 spectrum, NAAENMLEILGFK | 0.000 | 0.000 | 0.000 | 0.510 | 0.000 | 0.000 | 0.362 | 0.128 | ||
| 1 spectrum, AQGFQVEYK | 0.000 | 0.000 | 0.000 | 0.138 | 0.403 | 0.000 | 0.411 | 0.048 |
| Plot | Mito | Lyso or Perox | ER | Golgi | PM | Cytosol | Nucleus | ||||||
| Expt B |
7 peptides |
12 spectra |
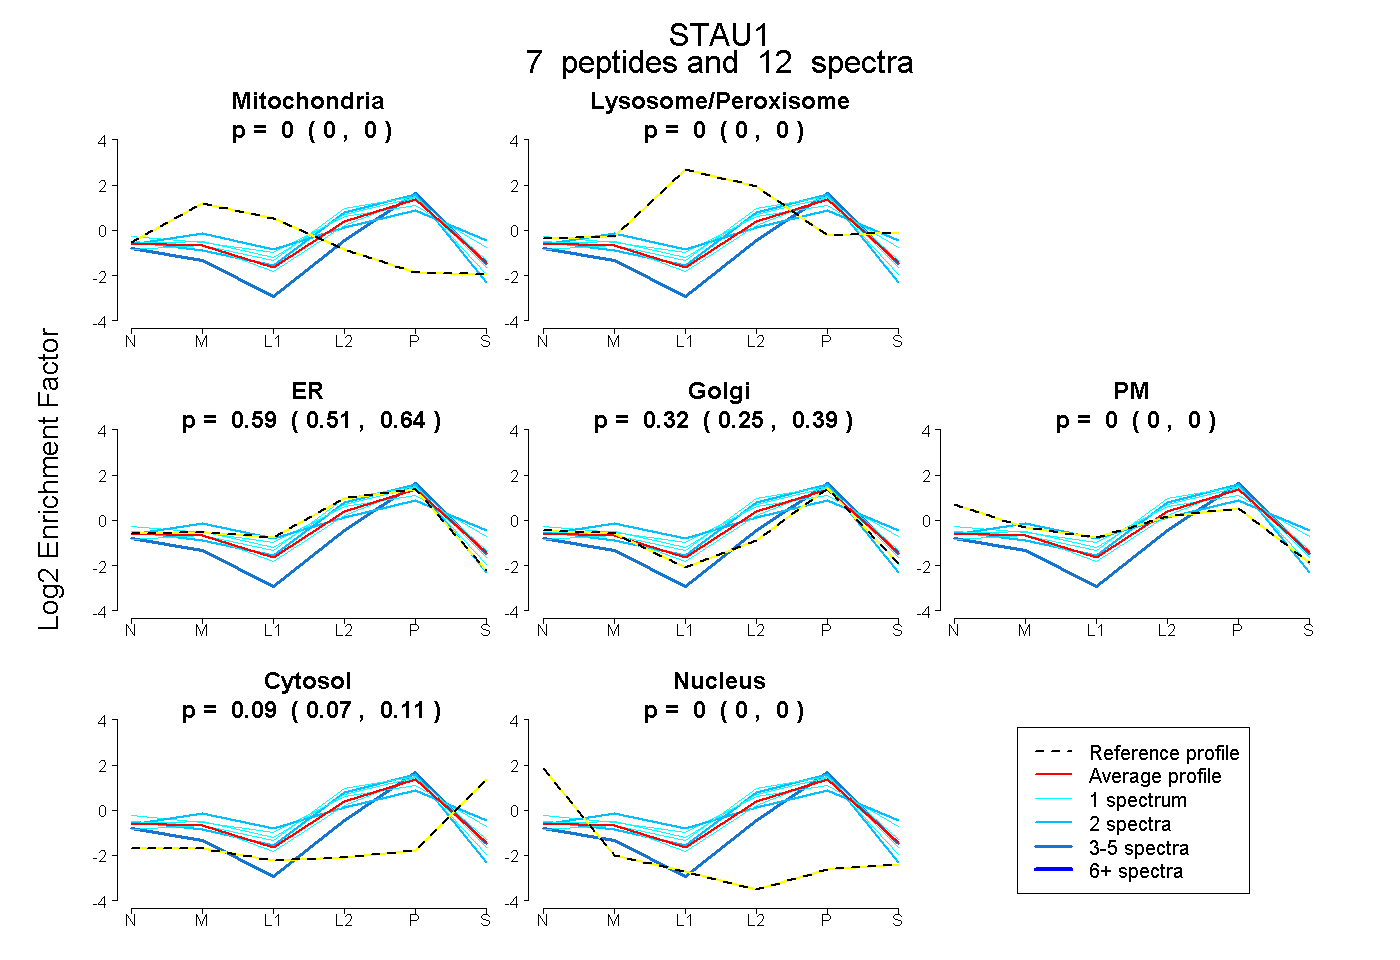 |
0.000 0.000 | 0.000 |
0.000 0.000 | 0.000 |
0.586 0.514 | 0.639 |
0.323 0.250 | 0.390 |
0.000 0.000 | 0.000 |
0.091 0.068 | 0.110 |
0.000 0.000 | 0.000 |
|||
| Plot | Lyso | Other | |||||||||||
| Expt C |
8 peptides |
14 spectra |
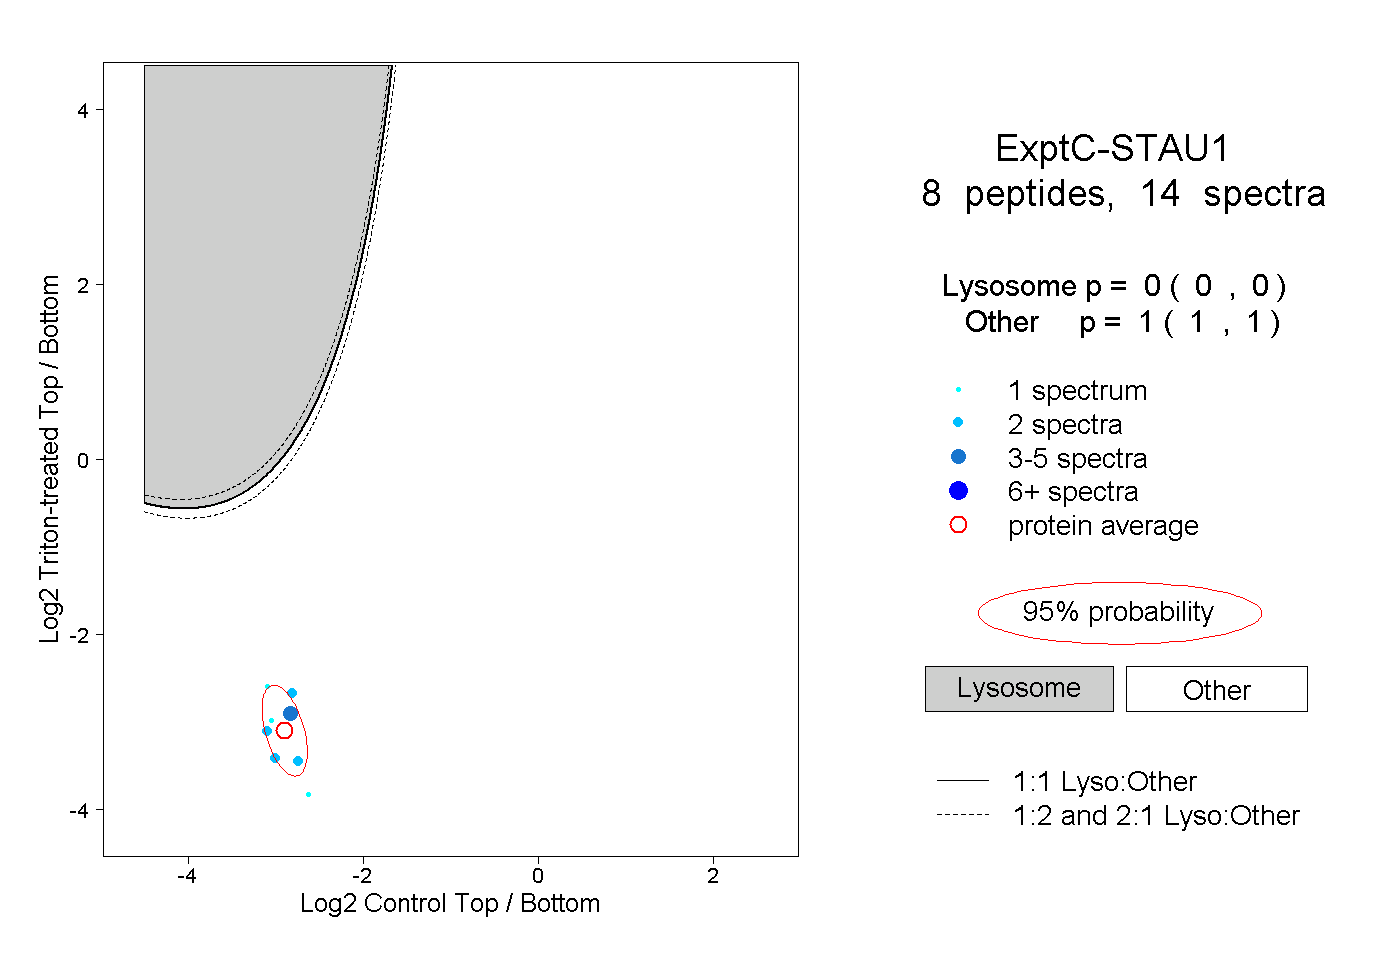 |
0.000 0.000 | 0.000 |
1.000 1.000 | 1.000 |
||||||||
| Plot | Lyso | Other | |||||||||||
| Expt D |
1 peptide |
1 spectrum |
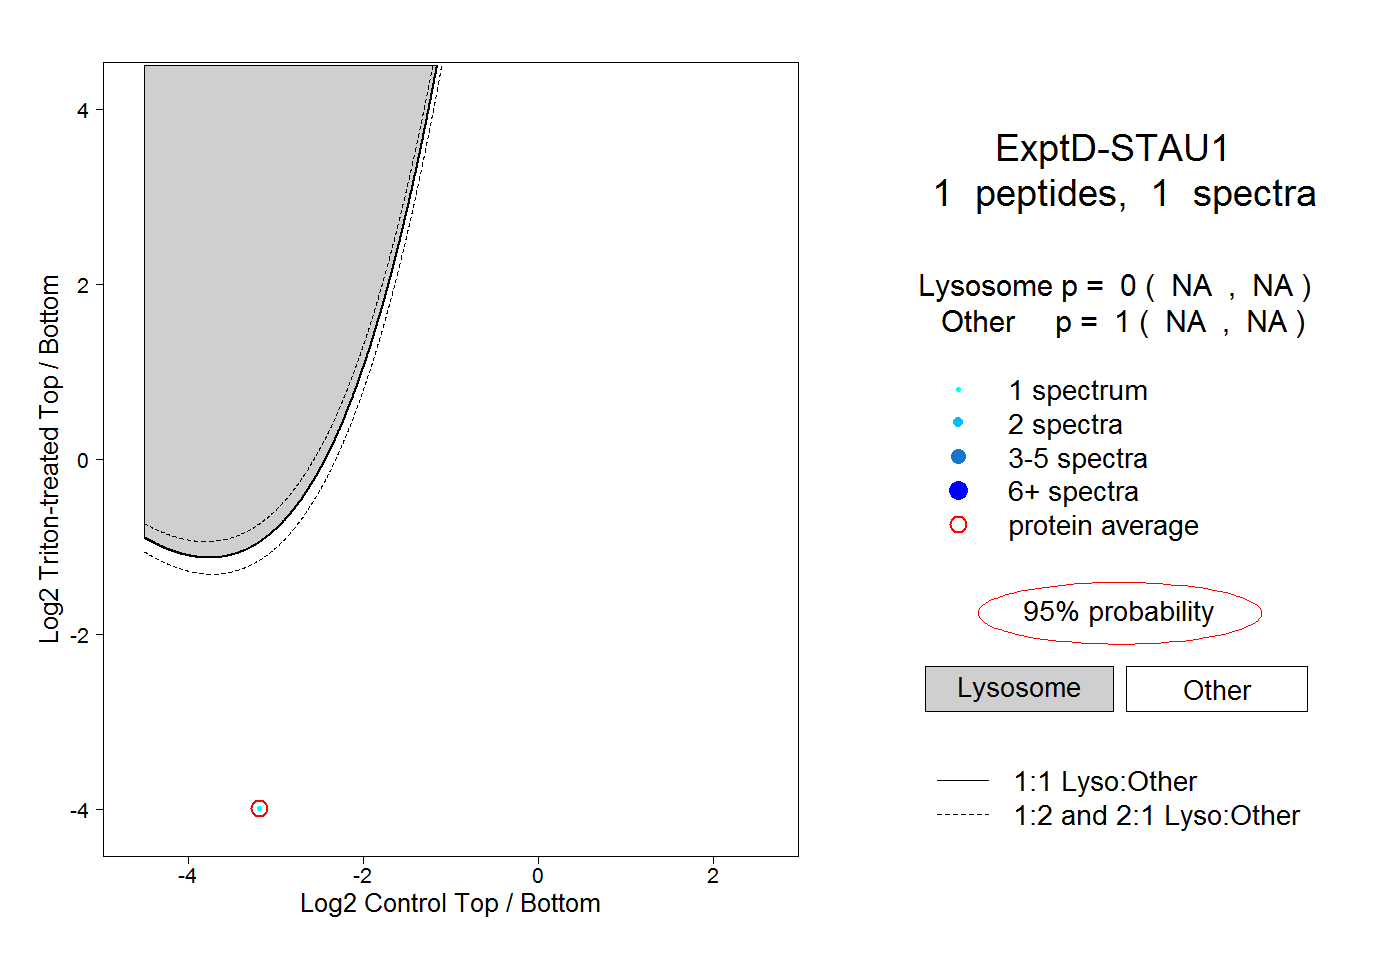 |
0.000 NA | NA |
1.000 NA | NA |