 2
2peptides
spectra
0.000 | 0.000
0.307 | 0.556
0.000 | 0.068
0.000 | 0.000
0.000 | 0.000
0.026 | 0.260
0.327 | 0.428
0.000 | 0.000
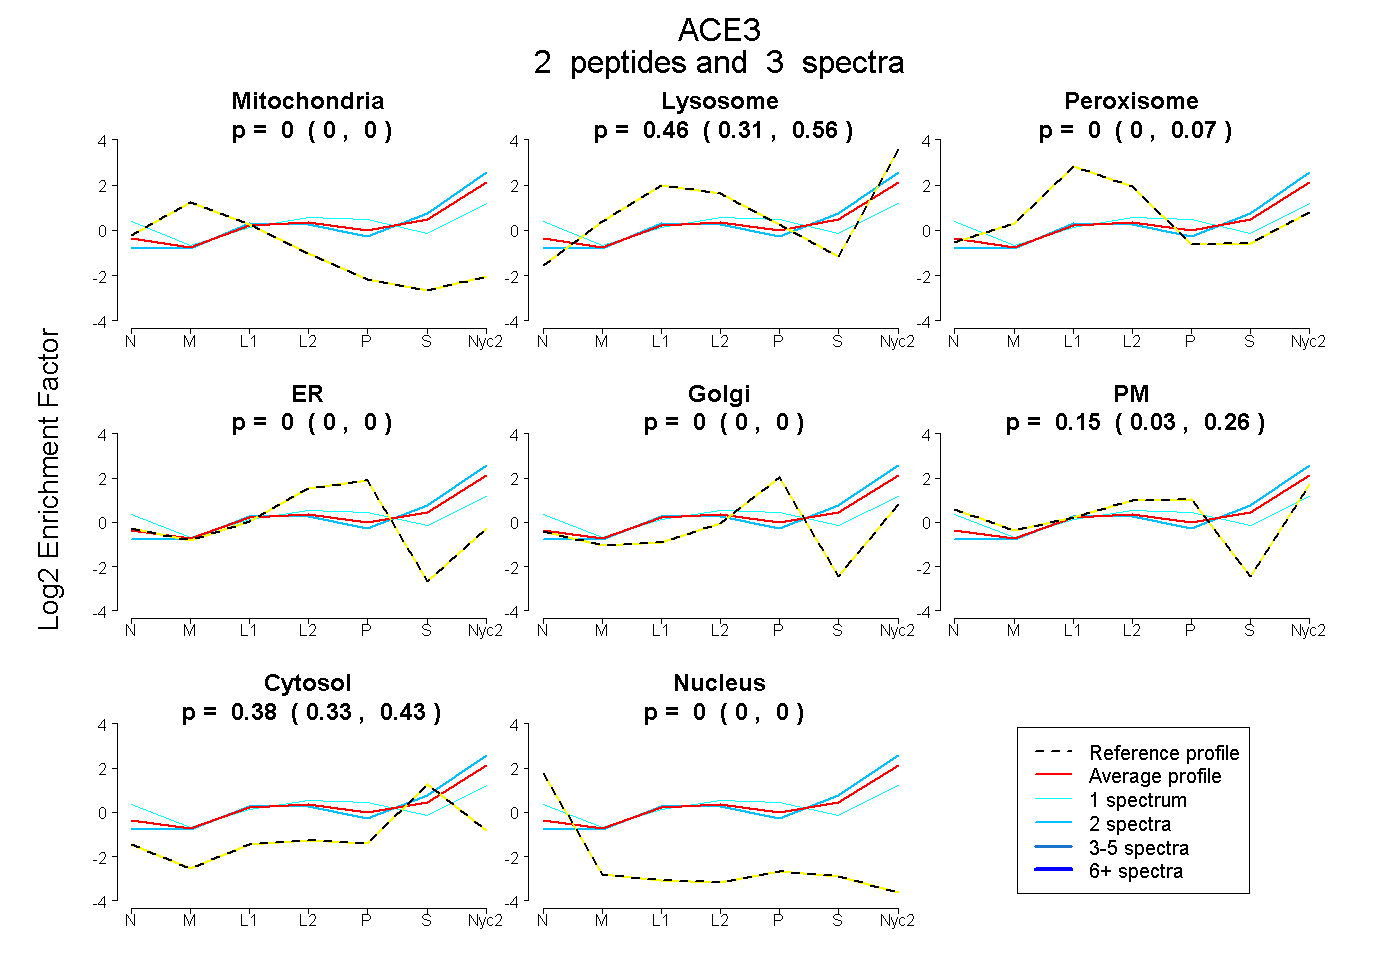
| Plot | Mito | Lyso | Perox | ER | Golgi | PM | Cytosol | Nucleus | |||||
| Expt A |
2 peptides |
3 spectra |
|
0.000 0.000 | 0.000 |
0.464 0.307 | 0.556 |
0.000 0.000 | 0.068 |
0.000 0.000 | 0.000 |
0.000 0.000 | 0.000 |
0.151 0.026 | 0.260 |
0.384 0.327 | 0.428 |
0.000 0.000 | 0.000 |
| 2 spectra, AILPFFPK | 0.000 | 0.590 | 0.000 | 0.000 | 0.000 | 0.000 | 0.410 | 0.000 | ||
| 1 spectrum, EAGHQGPLHQCDIYQSTK | 0.000 | 0.052 | 0.151 | 0.000 | 0.000 | 0.509 | 0.289 | 0.000 |
| Plot | Lyso | Other | |||||||||||
| Expt C |
2 peptides |
3 spectra |
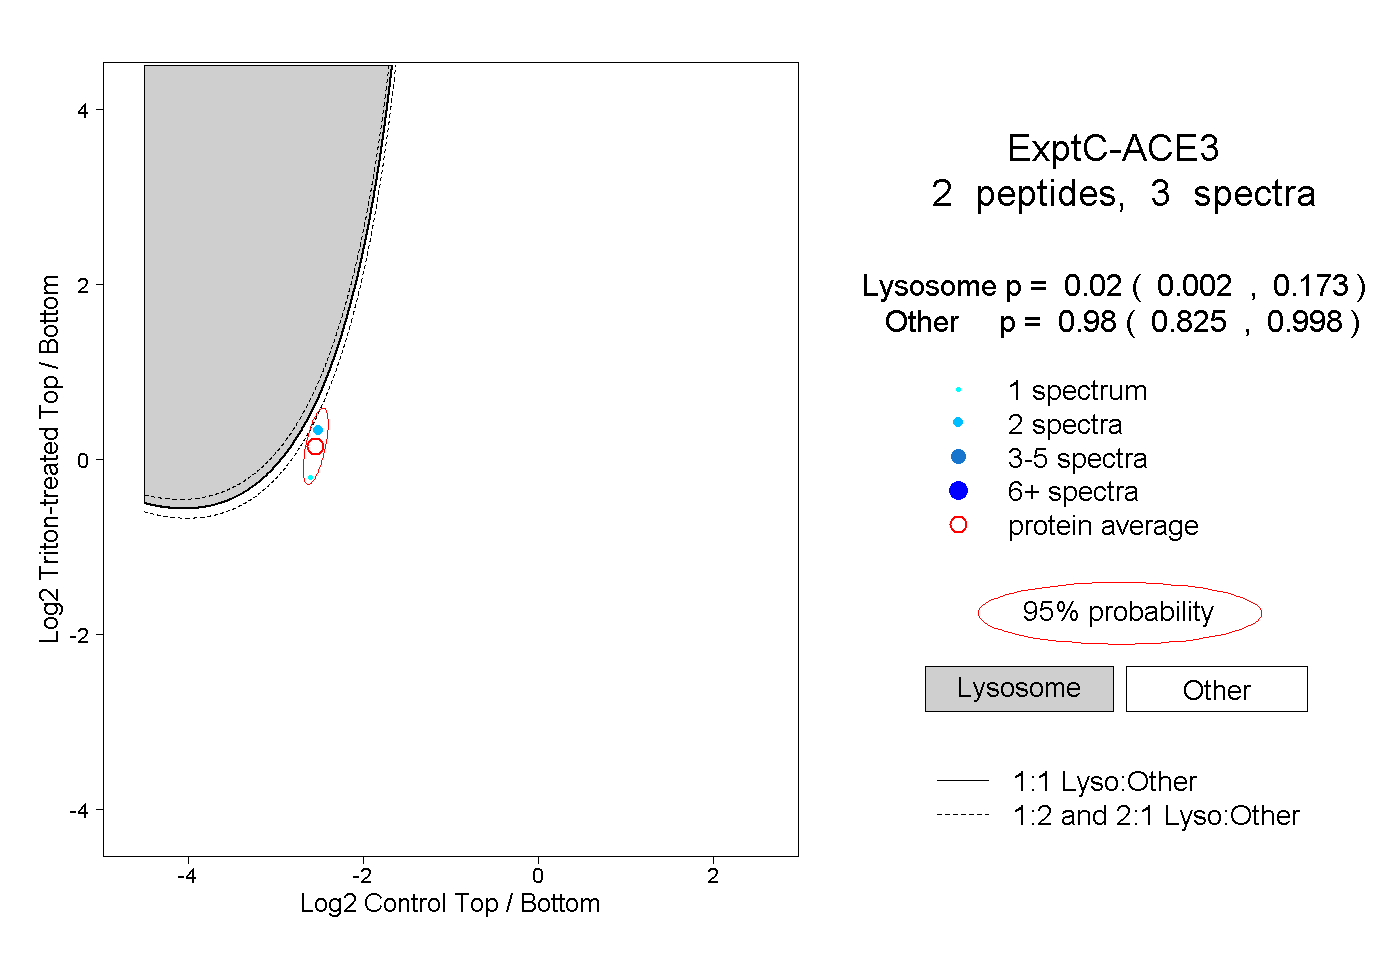 |
0.020 0.002 | 0.173 |
0.980 0.825 | 0.998 |