23
23peptides
spectra
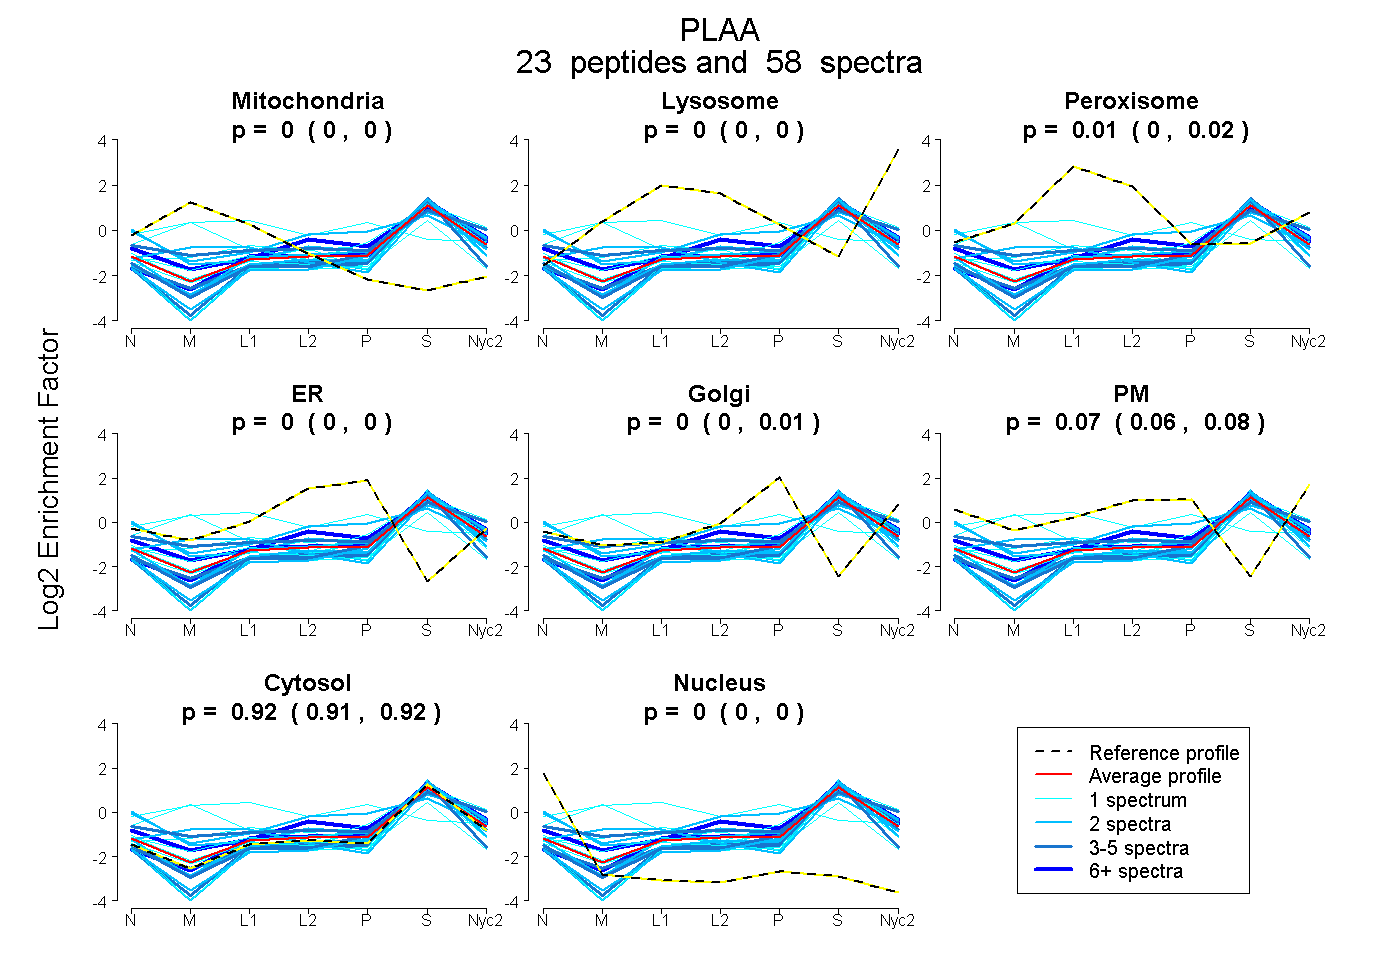
0.000 | 0.002
0.000 | 0.002
0.003 | 0.017
0.000 | 0.000
0.000 | 0.008
0.057 | 0.076
0.912 | 0.922
0.000 | 0.000
9peptides
spectra
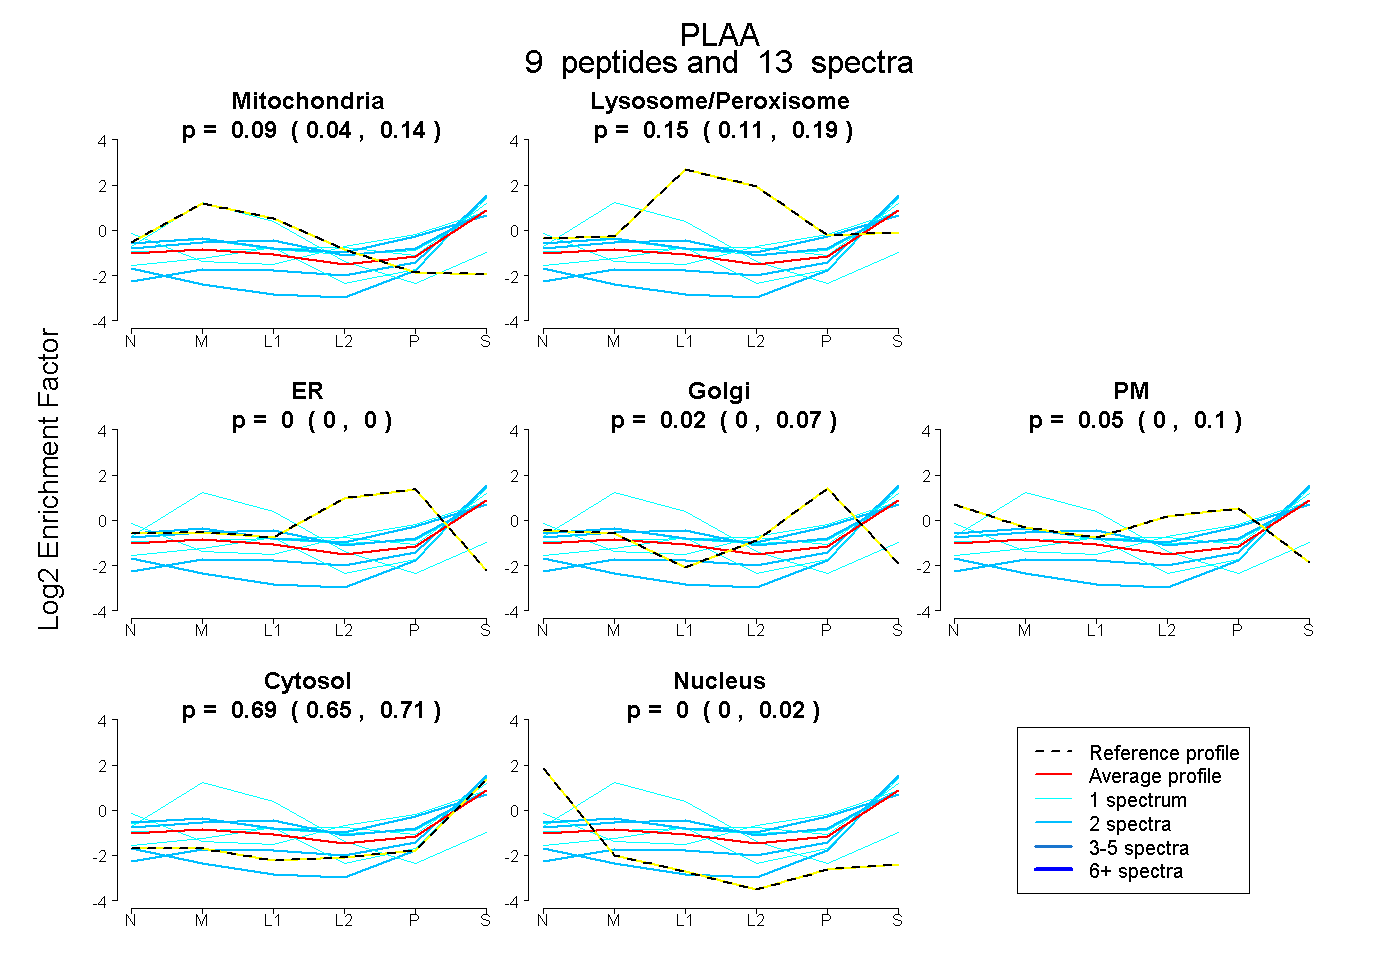
0.038 | 0.137
0.113 | 0.185
0.000 | 0.000
0.000 | 0.073
0.000 | 0.099
0.652 | 0.711
0.000 | 0.018
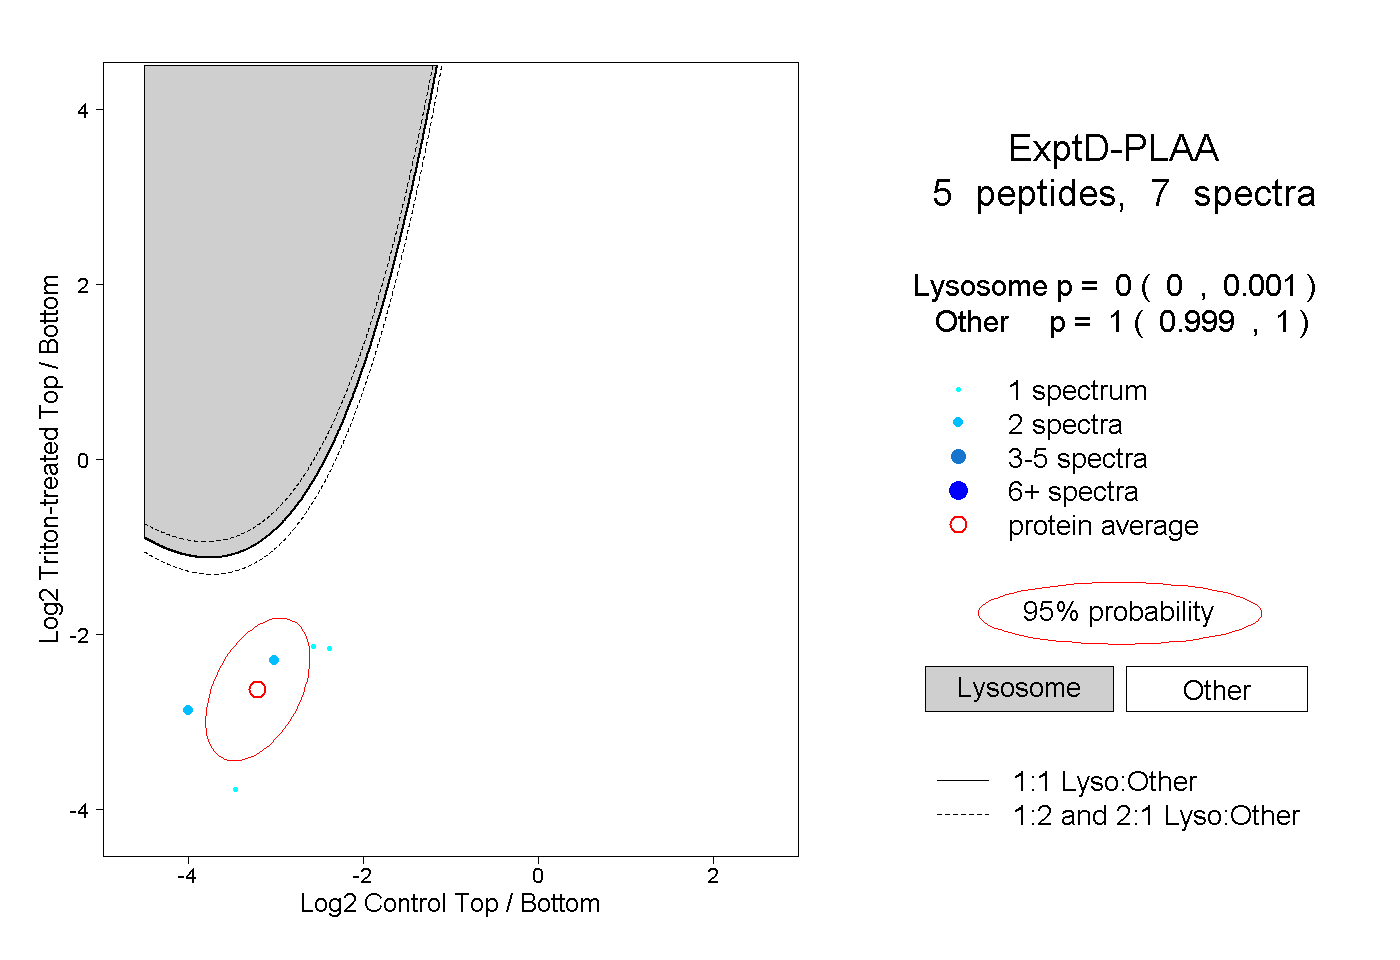
17peptides
spectra
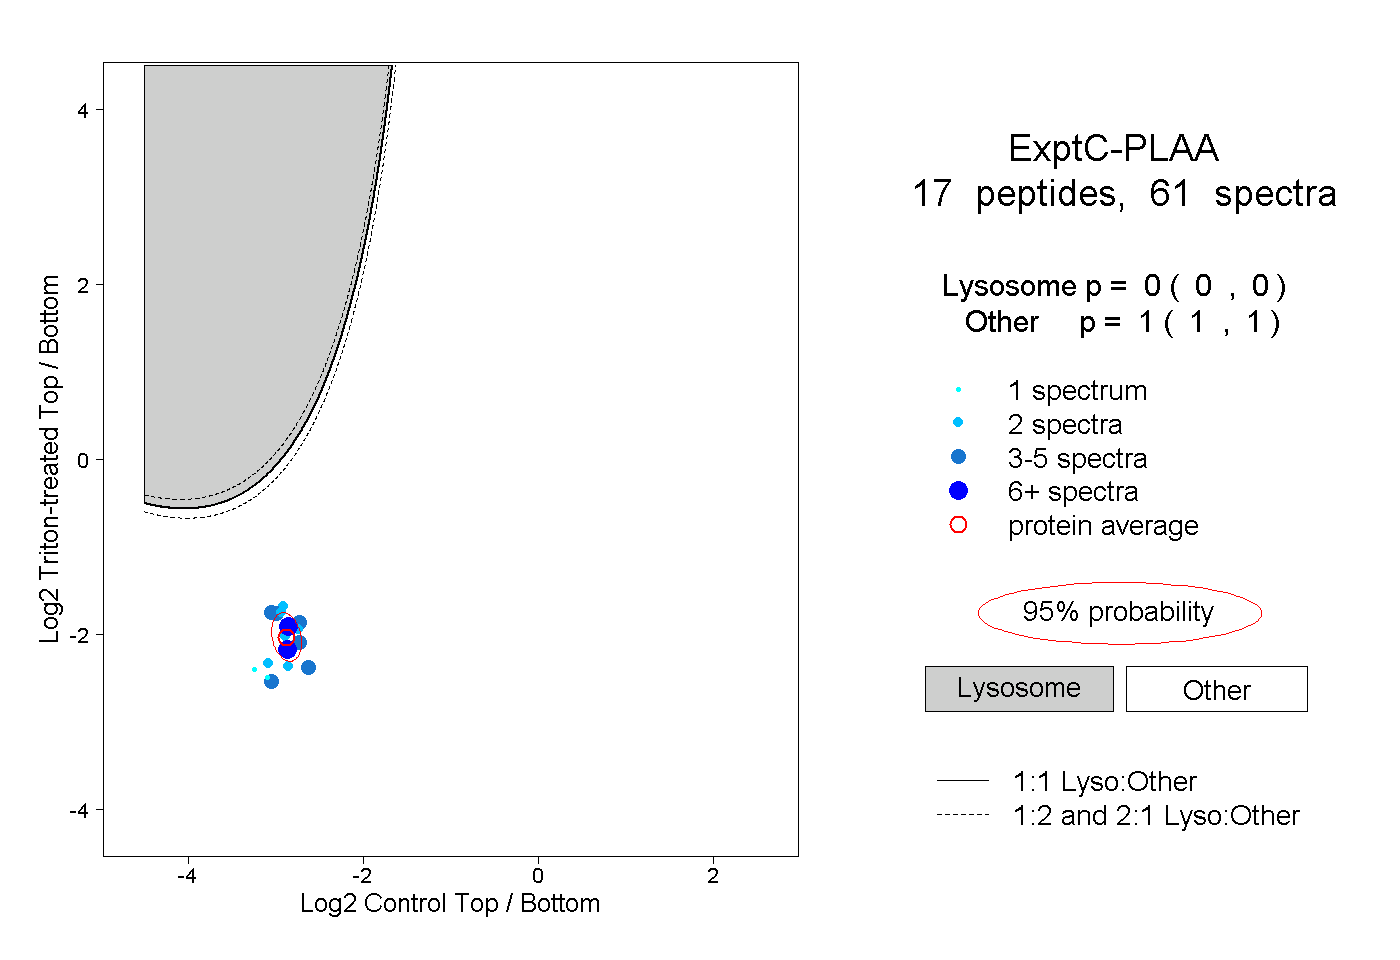
0.000 | 0.000
1.000 | 1.000