 23
23peptides
spectra
0.000 | 0.002
0.000 | 0.002
0.003 | 0.017
0.000 | 0.000
0.000 | 0.008
0.057 | 0.076
0.912 | 0.922
0.000 | 0.000
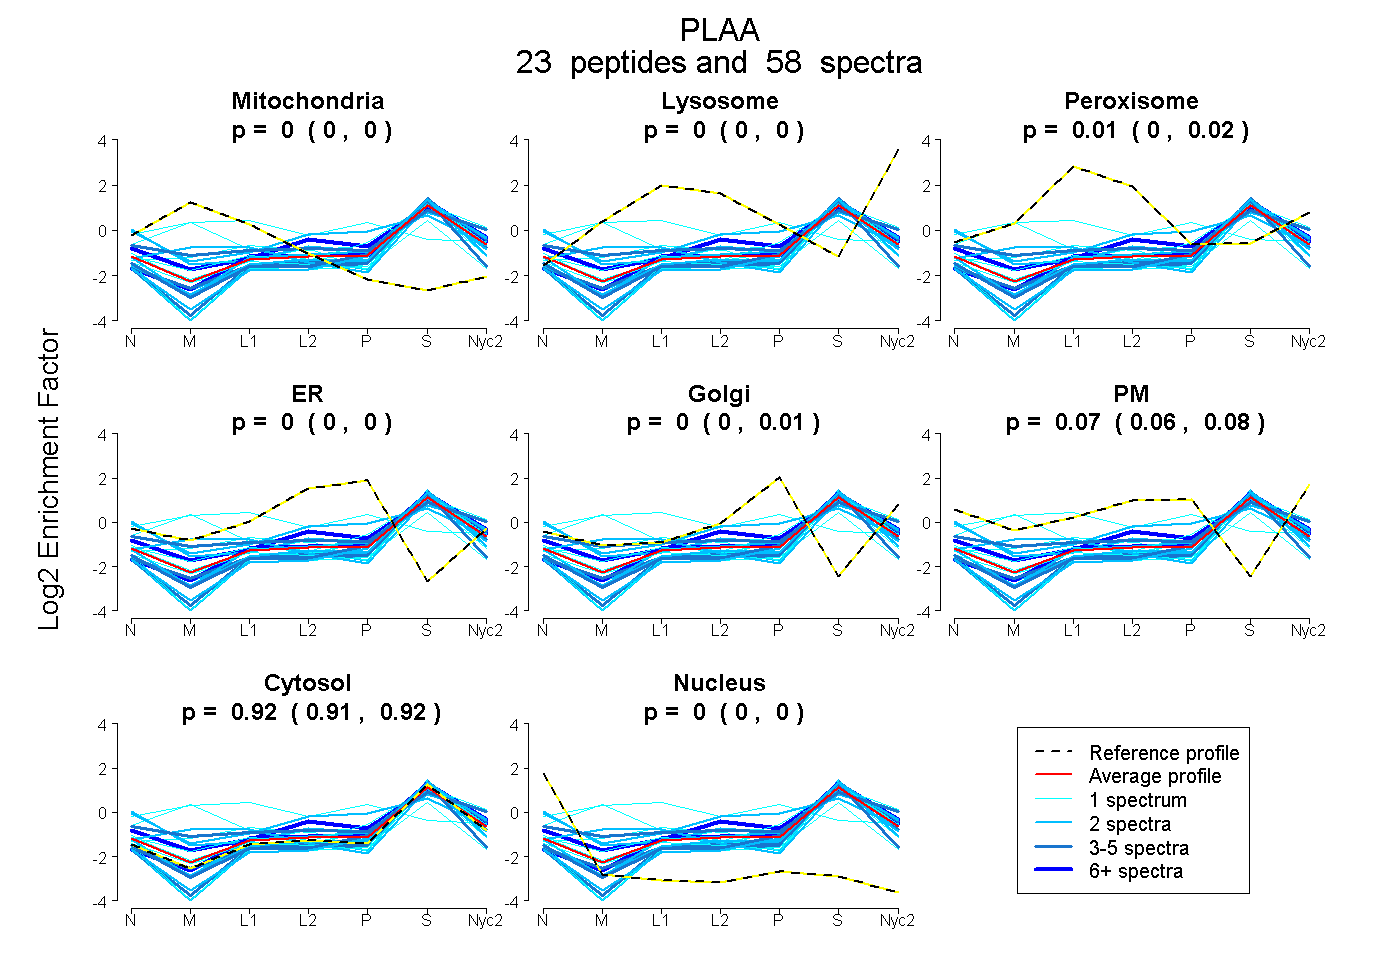
| Plot | Mito | Lyso | Perox | ER | Golgi | PM | Cytosol | Nucleus | |||||
| Expt A |
23 peptides |
58 spectra |
|
0.000 0.000 | 0.002 |
0.000 0.000 | 0.002 |
0.010 0.003 | 0.017 |
0.000 0.000 | 0.000 |
0.000 0.000 | 0.008 |
0.072 0.057 | 0.076 |
0.918 0.912 | 0.922 |
0.000 0.000 | 0.000 |
| 1 spectrum, IGDVVGSSGANQQTSGK | 0.000 | 0.000 | 0.000 | 0.000 | 0.077 | 0.000 | 0.919 | 0.003 | ||
| 6 spectra, EHLNEPGTR | 0.000 | 0.000 | 0.063 | 0.052 | 0.000 | 0.099 | 0.785 | 0.000 | ||
| 3 spectra, LWAPDSPNR | 0.000 | 0.010 | 0.000 | 0.000 | 0.000 | 0.000 | 0.990 | 0.000 | ||
| 2 spectra, DHNIEGK | 0.000 | 0.000 | 0.000 | 0.000 | 0.000 | 0.000 | 0.991 | 0.009 | ||
| 2 spectra, VFTEADER | 0.000 | 0.013 | 0.000 | 0.000 | 0.000 | 0.000 | 0.987 | 0.000 | ||
| 1 spectrum, TVNIYFPK | 0.013 | 0.011 | 0.000 | 0.000 | 0.000 | 0.000 | 0.975 | 0.000 | ||
| 2 spectra, TFSGHEDCVR | 0.000 | 0.000 | 0.038 | 0.193 | 0.000 | 0.134 | 0.629 | 0.006 | ||
| 1 spectrum, NDLNPMFLDQVAK | 0.219 | 0.000 | 0.315 | 0.000 | 0.275 | 0.000 | 0.191 | 0.000 | ||
| 1 spectrum, CMMTLQGHTAAVWAVK | 0.091 | 0.000 | 0.120 | 0.040 | 0.000 | 0.000 | 0.750 | 0.000 | ||
| 1 spectrum, GQTLGLGNTSFSDPFTGGGR | 0.000 | 0.000 | 0.000 | 0.000 | 0.000 | 0.000 | 1.000 | 0.000 | ||
| 4 spectra, VSECCR | 0.000 | 0.000 | 0.000 | 0.000 | 0.000 | 0.000 | 0.947 | 0.053 | ||
| 2 spectra, TASAEEIK | 0.000 | 0.033 | 0.000 | 0.000 | 0.046 | 0.000 | 0.920 | 0.000 | ||
| 10 spectra, LMMSQR | 0.000 | 0.068 | 0.000 | 0.000 | 0.000 | 0.000 | 0.932 | 0.000 | ||
| 2 spectra, HGECAQTIR | 0.000 | 0.000 | 0.000 | 0.000 | 0.000 | 0.271 | 0.705 | 0.024 | ||
| 1 spectrum, LTEDDLVLLEK | 0.000 | 0.000 | 0.000 | 0.000 | 0.000 | 0.000 | 1.000 | 0.000 | ||
| 5 spectra, YASVSEPAK | 0.057 | 0.098 | 0.028 | 0.000 | 0.000 | 0.117 | 0.701 | 0.000 | ||
| 2 spectra, VWLNDK | 0.000 | 0.000 | 0.000 | 0.000 | 0.000 | 0.000 | 0.980 | 0.020 | ||
| 2 spectra, VEAYQWSVSDGR | 0.218 | 0.000 | 0.052 | 0.000 | 0.000 | 0.000 | 0.730 | 0.000 | ||
| 1 spectrum, ESLMSHAIELK | 0.480 | 0.000 | 0.000 | 0.000 | 0.000 | 0.000 | 0.520 | 0.000 | ||
| 1 spectrum, FGTLLSGSWDTTAK | 0.011 | 0.000 | 0.070 | 0.000 | 0.000 | 0.000 | 0.917 | 0.001 | ||
| 1 spectrum, TFCNCFVSQAGQK | 0.000 | 0.109 | 0.000 | 0.000 | 0.094 | 0.000 | 0.796 | 0.000 | ||
| 2 spectra, DFVTTAEDR | 0.000 | 0.005 | 0.000 | 0.000 | 0.000 | 0.000 | 0.995 | 0.000 | ||
| 5 spectra, GKPANQLLALR | 0.000 | 0.000 | 0.000 | 0.000 | 0.000 | 0.000 | 1.000 | 0.000 |
| Plot | Mito | Lyso or Perox | ER | Golgi | PM | Cytosol | Nucleus | ||||||
| Expt B |
9 peptides |
13 spectra |
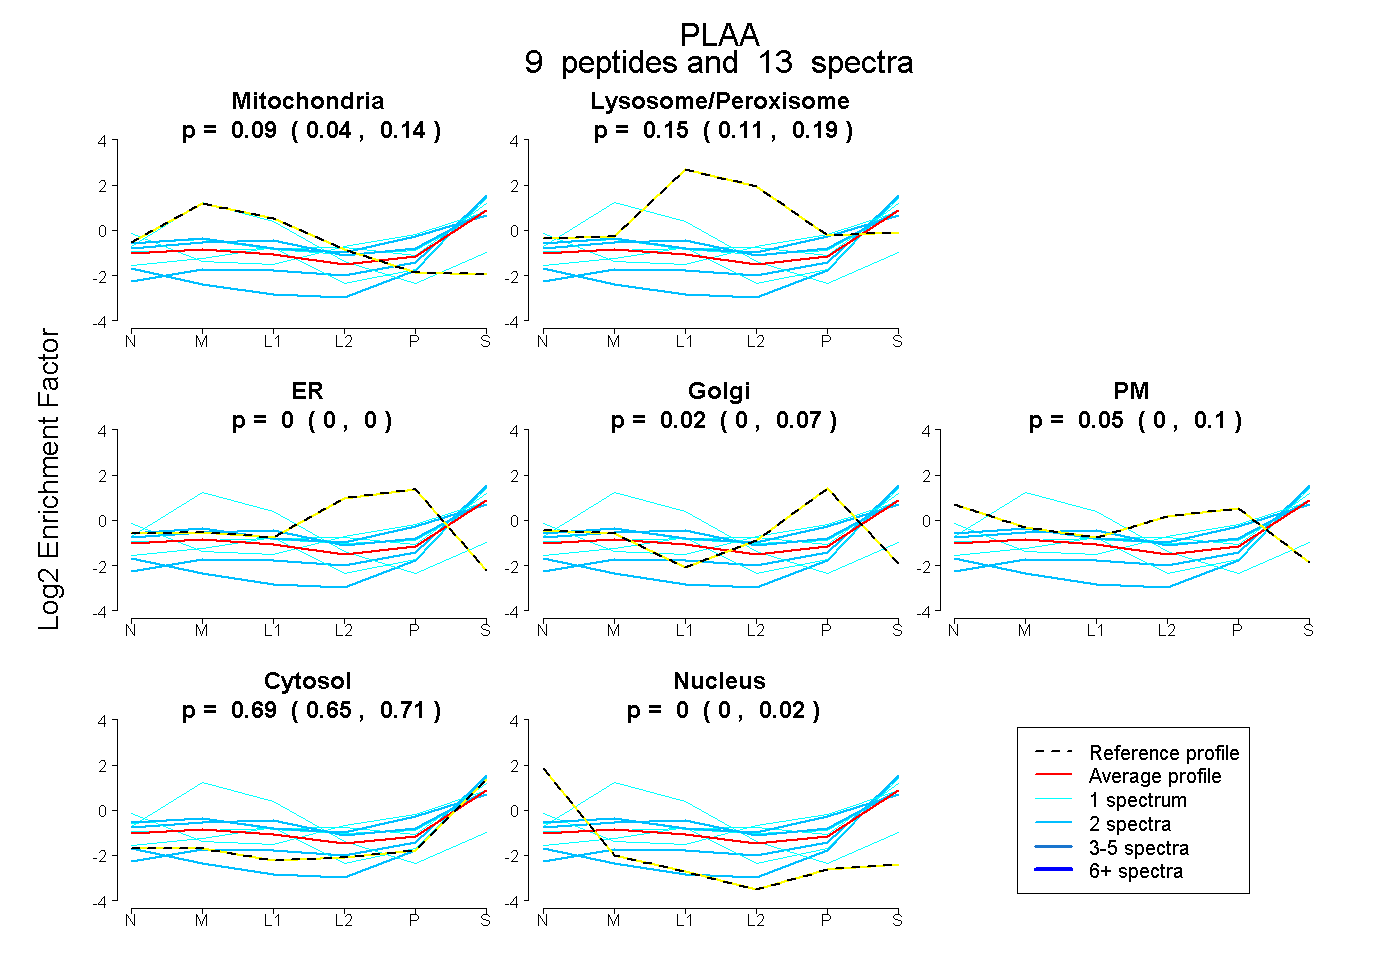 |
0.093 0.038 | 0.137 |
0.149 0.113 | 0.185 |
0.000 0.000 | 0.000 |
0.022 0.000 | 0.073 |
0.049 0.000 | 0.099 |
0.687 0.652 | 0.711 |
0.000 0.000 | 0.018 |
|||
| Plot | Lyso | Other | |||||||||||
| Expt C |
17 peptides |
61 spectra |
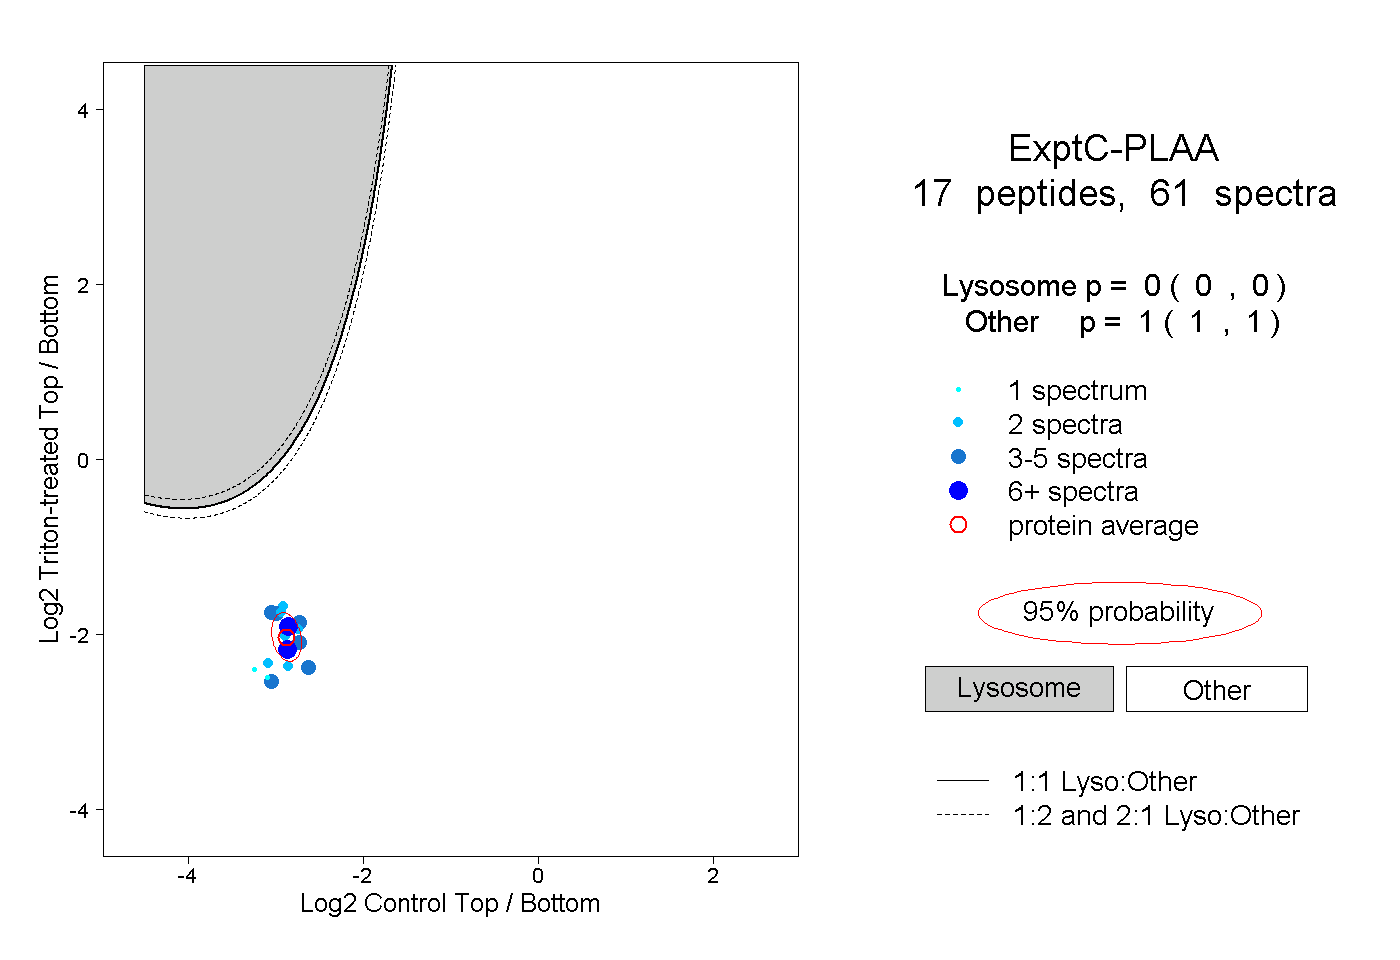 |
0.000 0.000 | 0.000 |
1.000 1.000 | 1.000 |
||||||||
| Plot | Lyso | Other | |||||||||||
| Expt D |
5 peptides |
7 spectra |
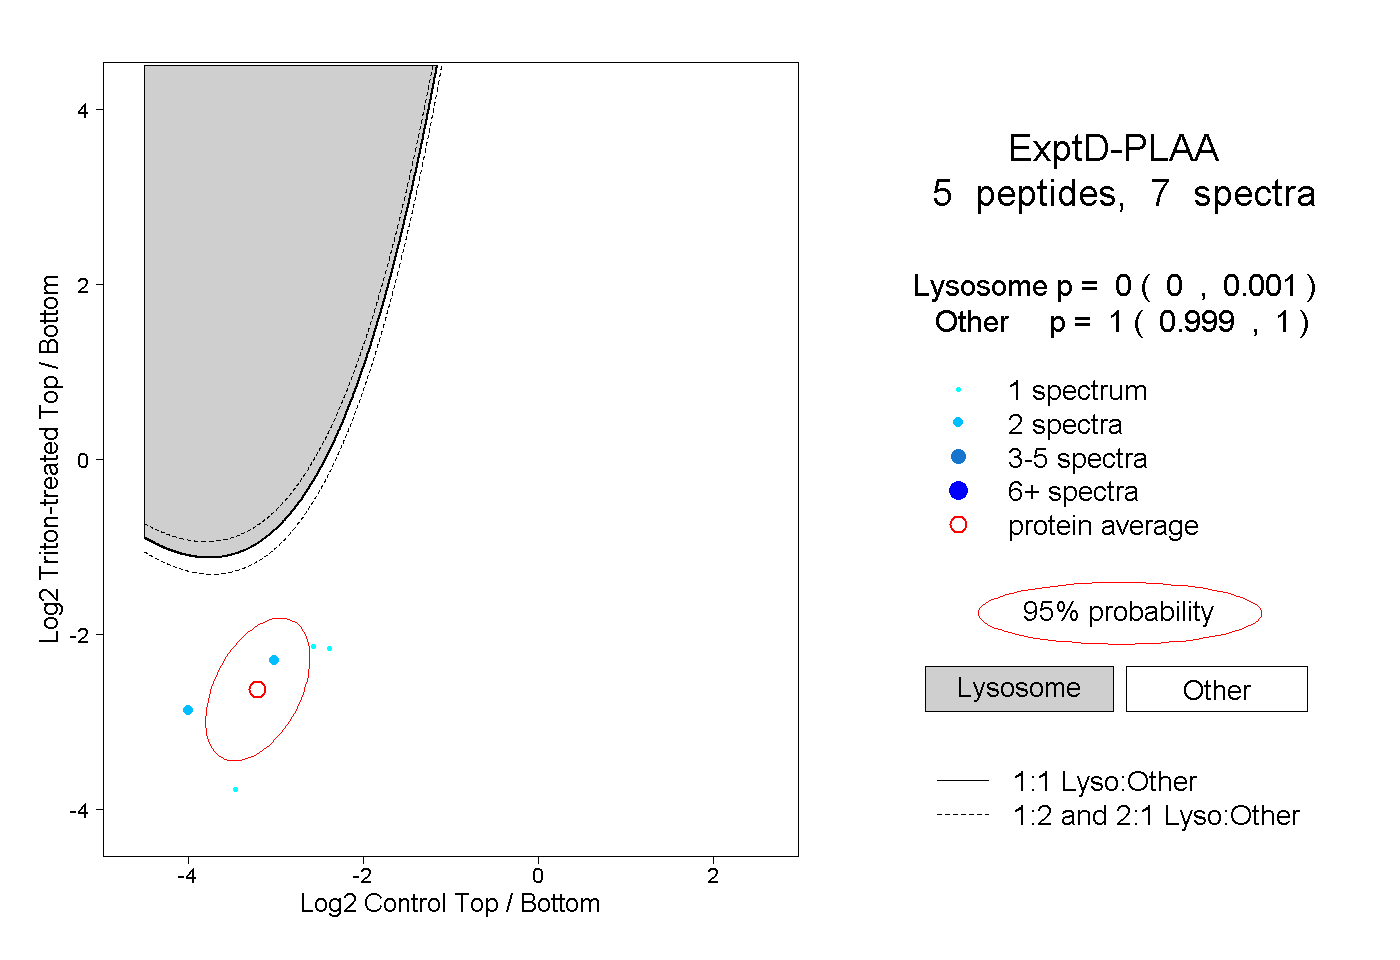 |
0.000 0.000 | 0.001 |
1.000 0.999 | 1.000 |