 4
4peptides
spectra
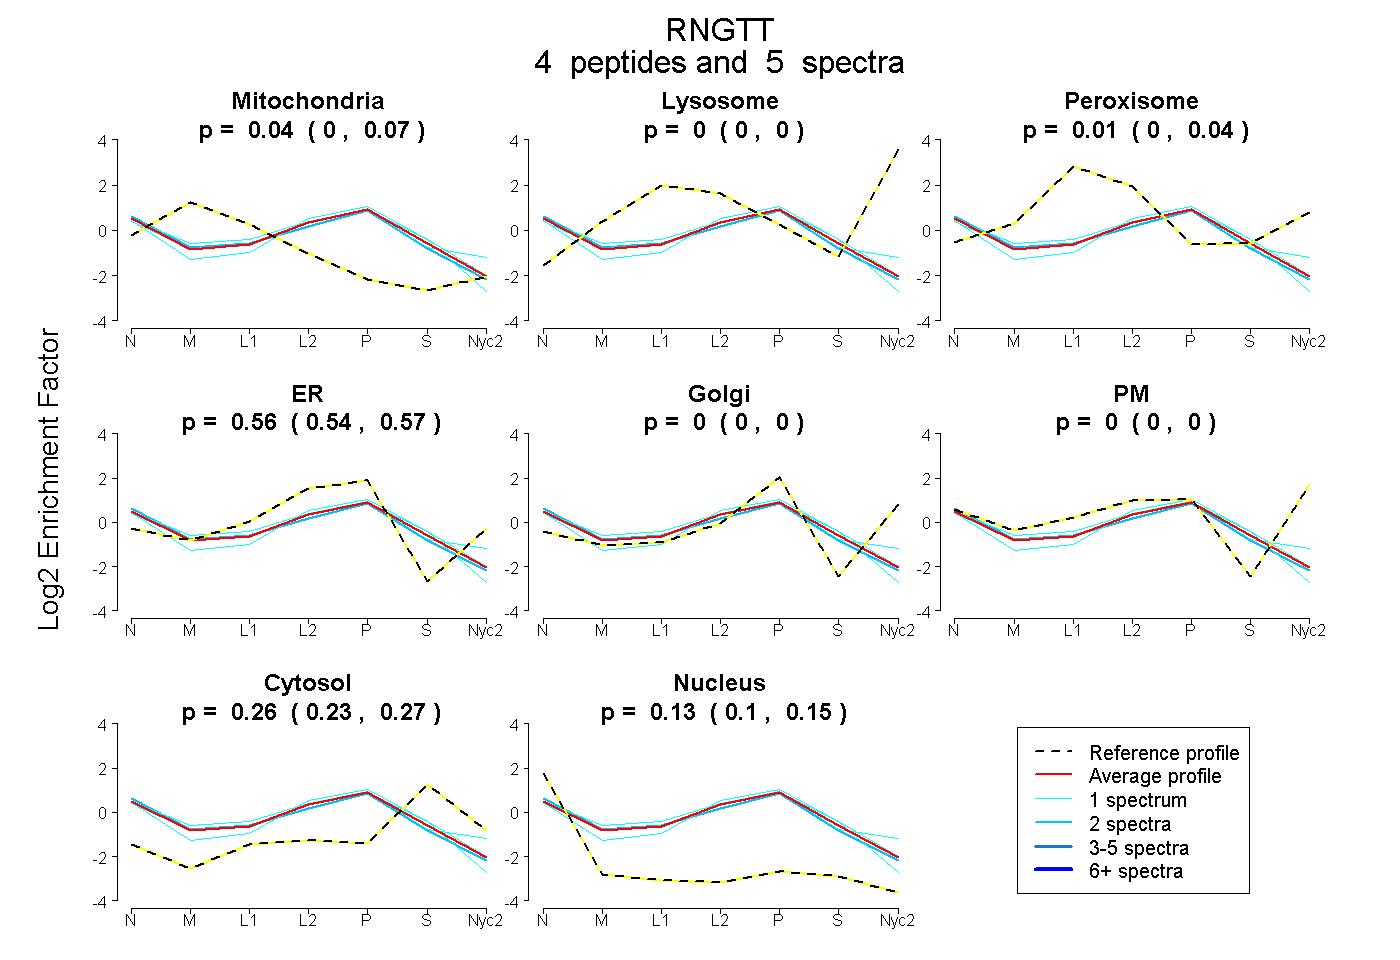
0.000 | 0.073
0.000 | 0.000
0.000 | 0.043
0.544 | 0.573
0.000 | 0.000
0.000 | 0.000
0.234 | 0.274
0.104 | 0.148
| Plot | Mito | Lyso | Perox | ER | Golgi | PM | Cytosol | Nucleus | |||||
| Expt A |
4 peptides |
5 spectra |
|
0.044 0.000 | 0.073 |
0.000 0.000 | 0.000 |
0.010 0.000 | 0.043 |
0.562 0.544 | 0.573 |
0.000 0.000 | 0.000 |
0.000 0.000 | 0.000 |
0.258 0.234 | 0.274 |
0.125 0.104 | 0.148 |
| 1 spectrum, TQEPFSVRPK | 0.060 | 0.000 | 0.000 | 0.548 | 0.000 | 0.000 | 0.305 | 0.087 | ||
| 1 spectrum, QFFDINISR | 0.039 | 0.000 | 0.089 | 0.560 | 0.000 | 0.000 | 0.220 | 0.092 | ||
| 2 spectra, MSLLVDLTNTSR | 0.079 | 0.000 | 0.008 | 0.548 | 0.000 | 0.000 | 0.209 | 0.156 | ||
| 1 spectrum, YDSQVAEENR | 0.000 | 0.000 | 0.000 | 0.552 | 0.000 | 0.000 | 0.278 | 0.170 |
| Plot | Lyso | Other | |||||||||||
| Expt C |
4 peptides |
4 spectra |
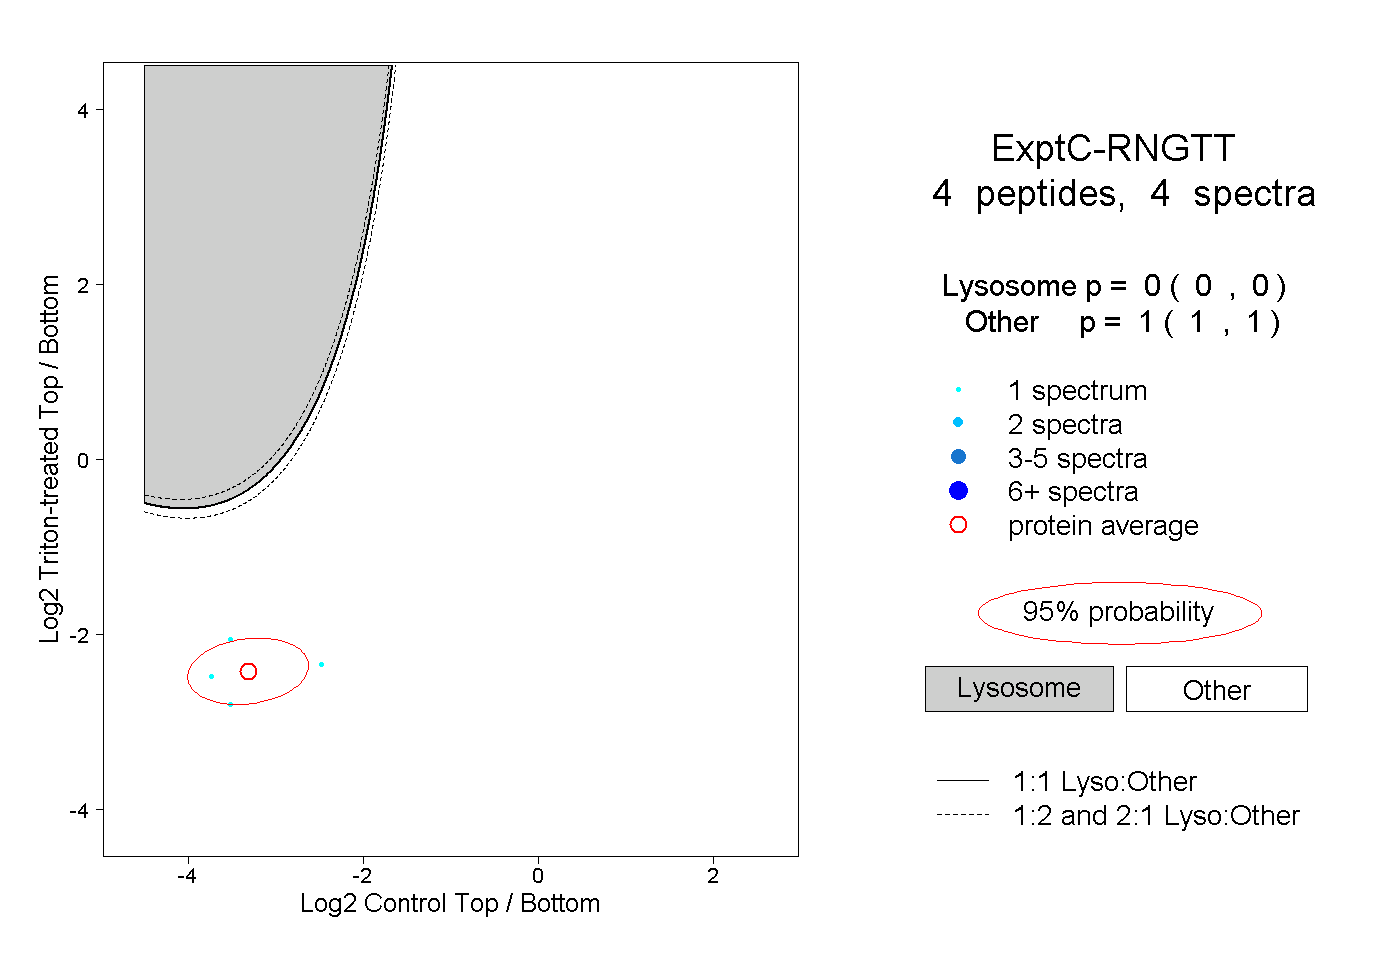 |
0.000 0.000 | 0.000 |
1.000 1.000 | 1.000 |