 12
12peptides
spectra
0.000 | 0.000
0.000 | 0.000
0.000 | 0.000
0.705 | 0.750
0.169 | 0.225
0.000 | 0.000
0.000 | 0.005
0.061 | 0.076
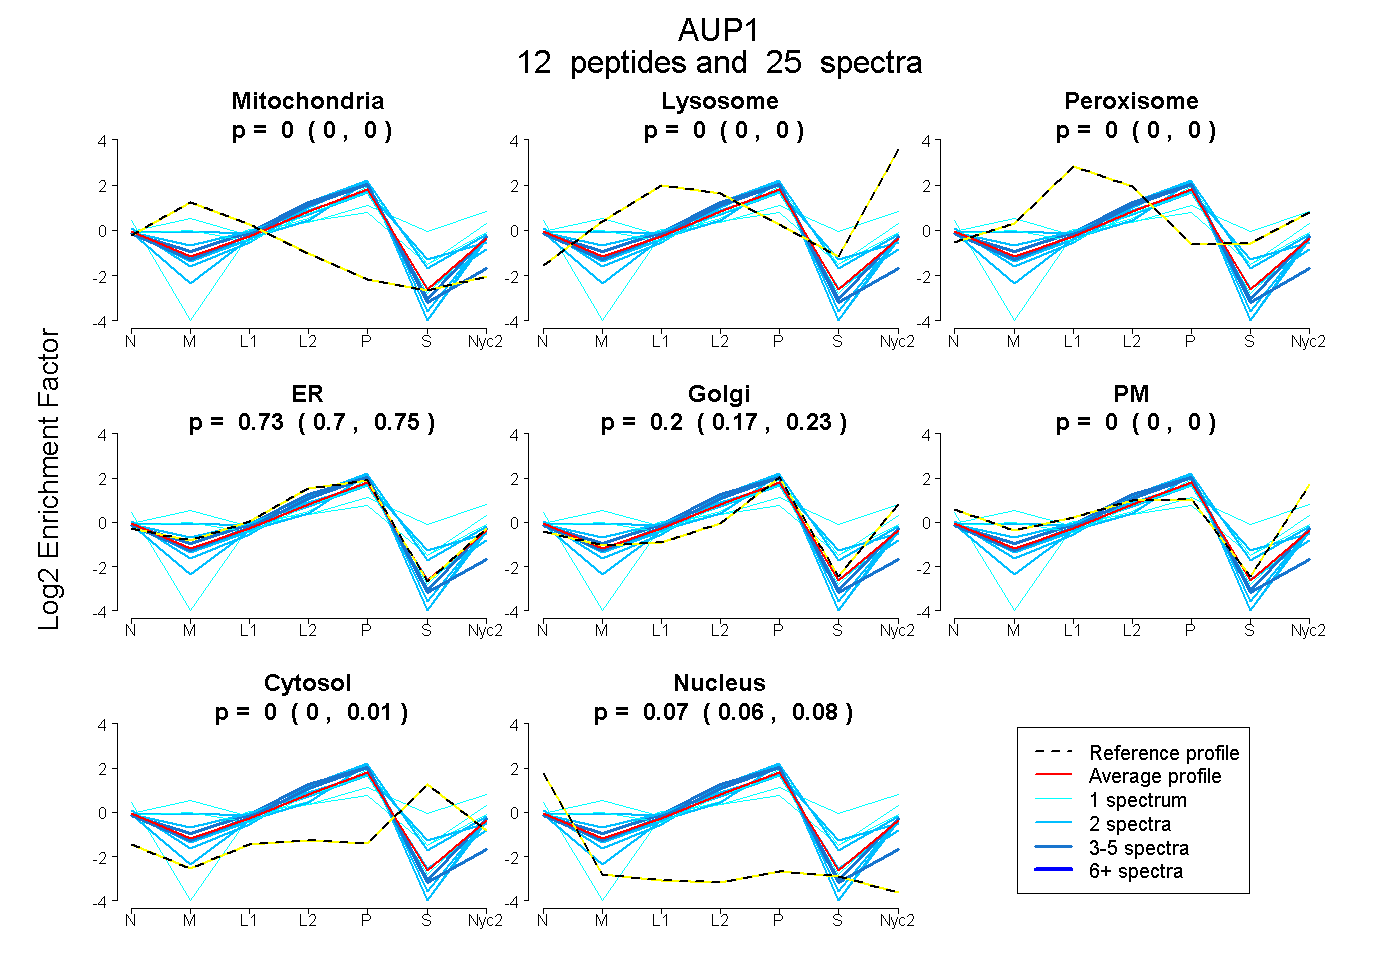
| Plot | Mito | Lyso | Perox | ER | Golgi | PM | Cytosol | Nucleus | |||||
| Expt A |
12 peptides |
25 spectra |
|
0.000 0.000 | 0.000 |
0.000 0.000 | 0.000 |
0.000 0.000 | 0.000 |
0.728 0.705 | 0.750 |
0.202 0.169 | 0.225 |
0.000 0.000 | 0.000 |
0.000 0.000 | 0.005 |
0.070 0.061 | 0.076 |
| 1 spectrum, GFMEMDR | 0.239 | 0.000 | 0.174 | 0.093 | 0.413 | 0.064 | 0.017 | 0.000 | ||
| 5 spectra, TMCAVLGLVAR | 0.000 | 0.000 | 0.000 | 0.907 | 0.000 | 0.000 | 0.000 | 0.093 | ||
| 2 spectra, QESLQER | 0.000 | 0.000 | 0.000 | 0.444 | 0.394 | 0.000 | 0.159 | 0.004 | ||
| 4 spectra, WLHPIR | 0.000 | 0.000 | 0.000 | 0.797 | 0.164 | 0.000 | 0.000 | 0.039 | ||
| 1 spectrum, EVLPHVPLNVIQR | 0.000 | 0.000 | 0.000 | 0.346 | 0.424 | 0.000 | 0.224 | 0.006 | ||
| 2 spectra, LFDSHR | 0.000 | 0.000 | 0.000 | 0.740 | 0.197 | 0.000 | 0.000 | 0.064 | ||
| 2 spectra, VELVESLK | 0.000 | 0.000 | 0.054 | 0.736 | 0.037 | 0.000 | 0.173 | 0.000 | ||
| 2 spectra, QEDSGLR | 0.000 | 0.000 | 0.000 | 0.837 | 0.127 | 0.000 | 0.000 | 0.037 | ||
| 2 spectra, QLGEENEEFALR | 0.183 | 0.000 | 0.000 | 0.704 | 0.113 | 0.000 | 0.000 | 0.000 | ||
| 2 spectra, ELGQIGTR | 0.000 | 0.000 | 0.000 | 0.876 | 0.074 | 0.000 | 0.000 | 0.050 | ||
| 1 spectrum, FPSSGLVTPQPTALTFAK | 0.000 | 0.053 | 0.196 | 0.000 | 0.317 | 0.172 | 0.262 | 0.000 | ||
| 1 spectrum, VQQLVAK | 0.142 | 0.000 | 0.000 | 0.581 | 0.277 | 0.000 | 0.000 | 0.000 |
| Plot | Mito | Lyso or Perox | ER | Golgi | PM | Cytosol | Nucleus | ||||||
| Expt B |
6 peptides |
10 spectra |
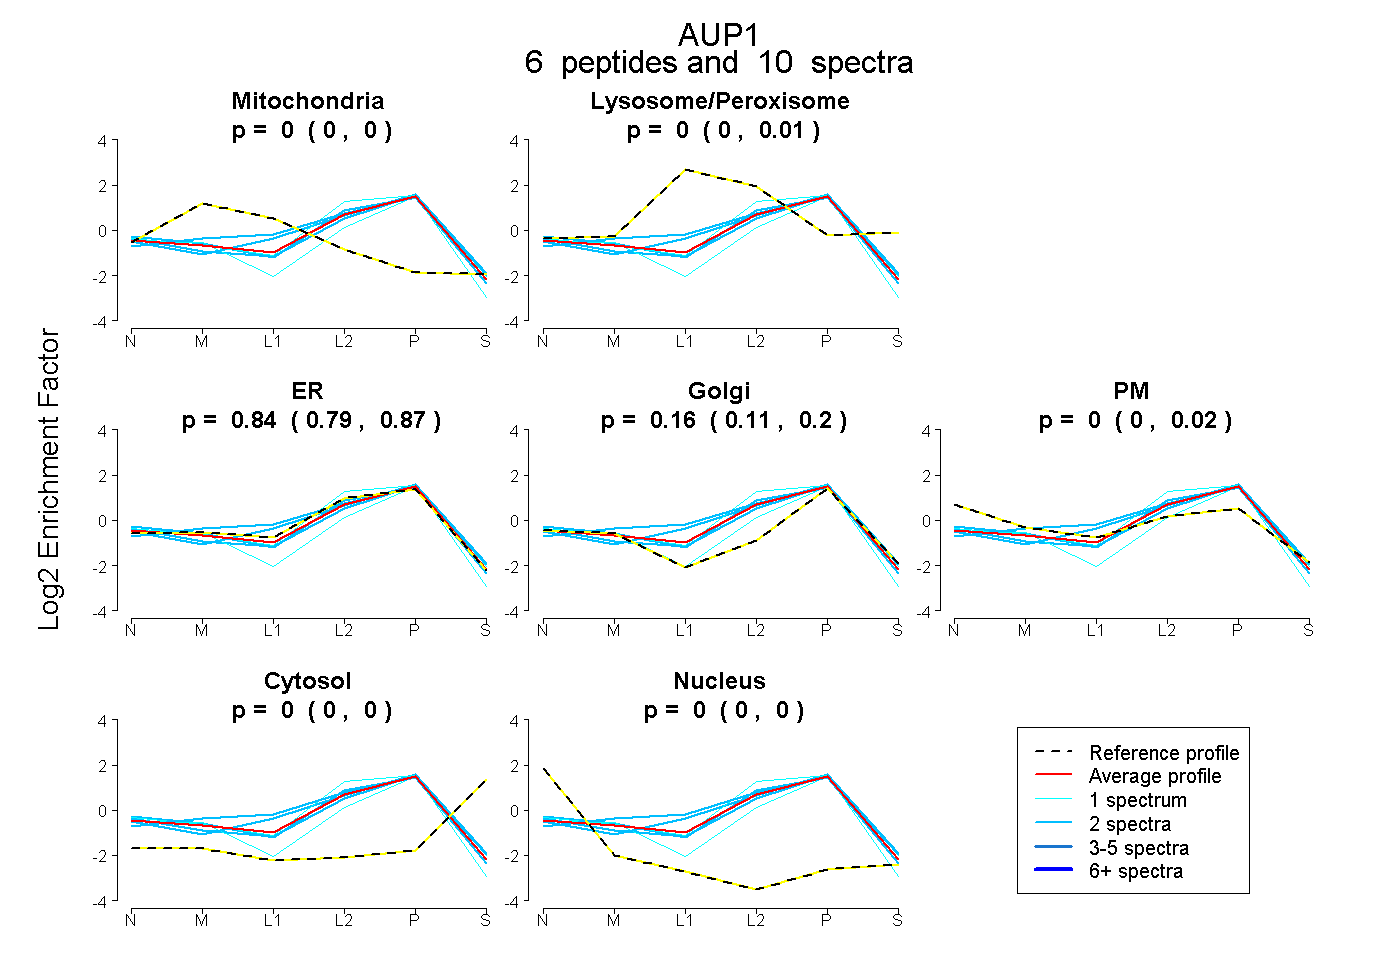 |
0.000 0.000 | 0.000 |
0.000 0.000 | 0.006 |
0.836 0.789 | 0.872 |
0.164 0.111 | 0.201 |
0.000 0.000 | 0.018 |
0.000 0.000 | 0.000 |
0.000 0.000 | 0.000 |
|||
| Plot | Lyso | Other | |||||||||||
| Expt C |
11 peptides |
38 spectra |
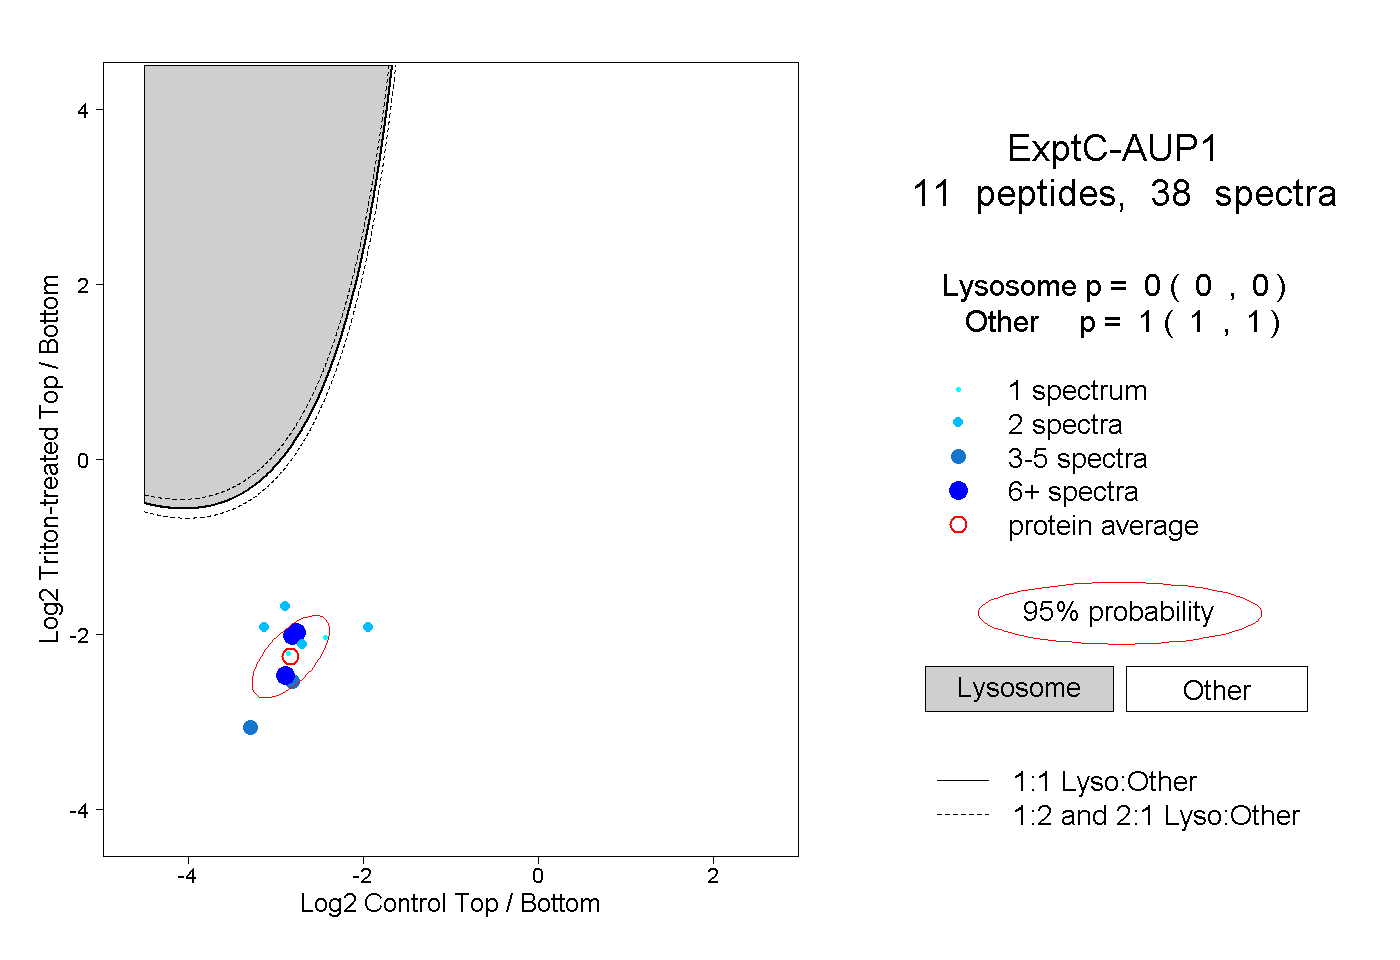 |
0.000 0.000 | 0.000 |
1.000 1.000 | 1.000 |
||||||||
| Plot | Lyso | Other | |||||||||||
| Expt D |
2 peptides |
4 spectra |
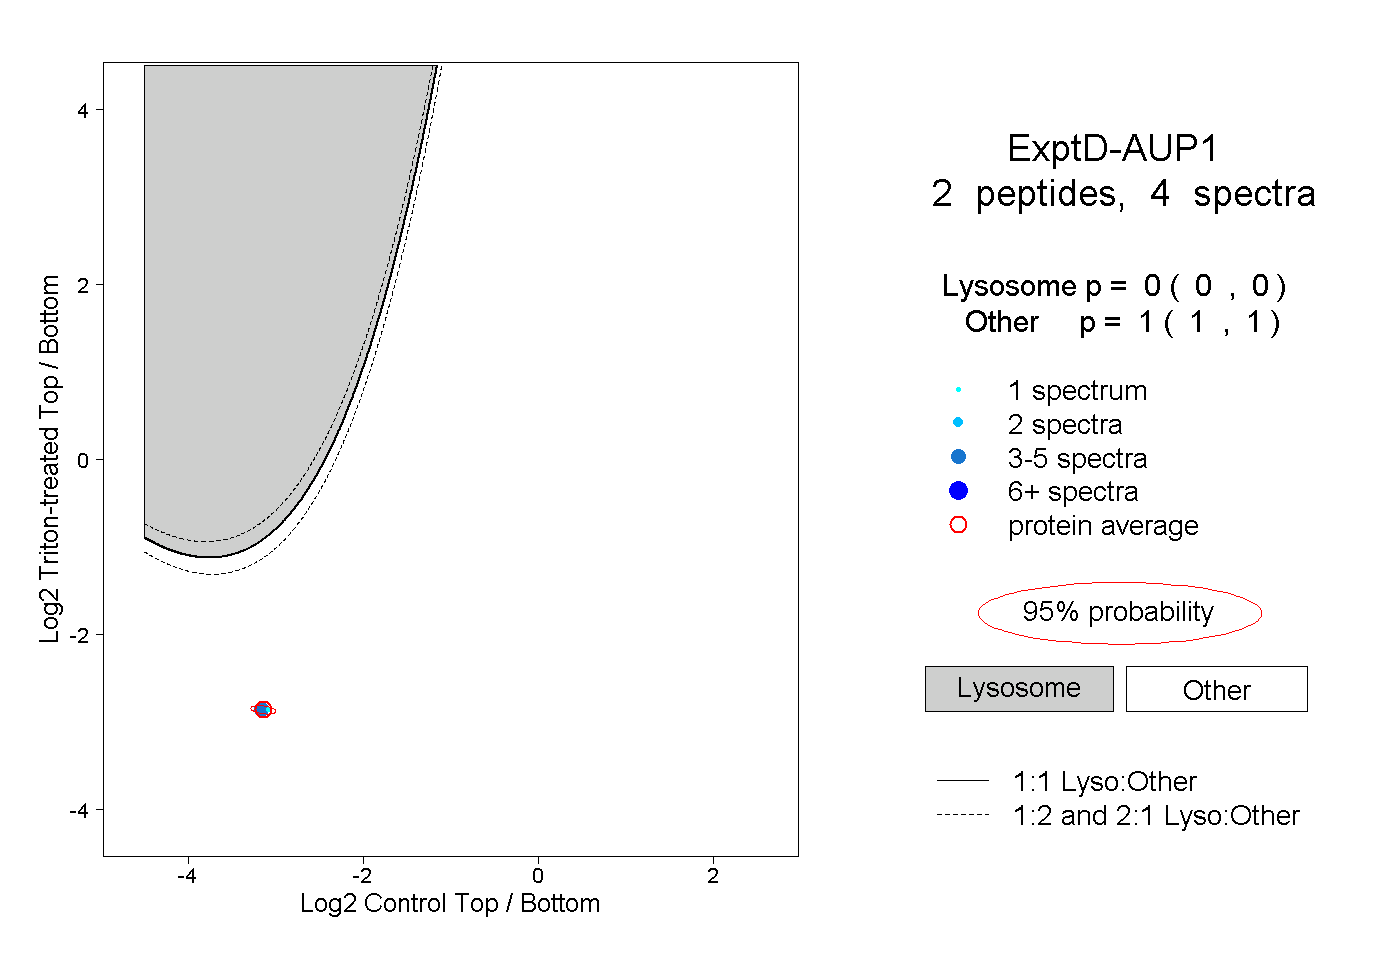 |
0.000 0.000 | 0.000 |
1.000 1.000 | 1.000 |