14
14peptides
spectra
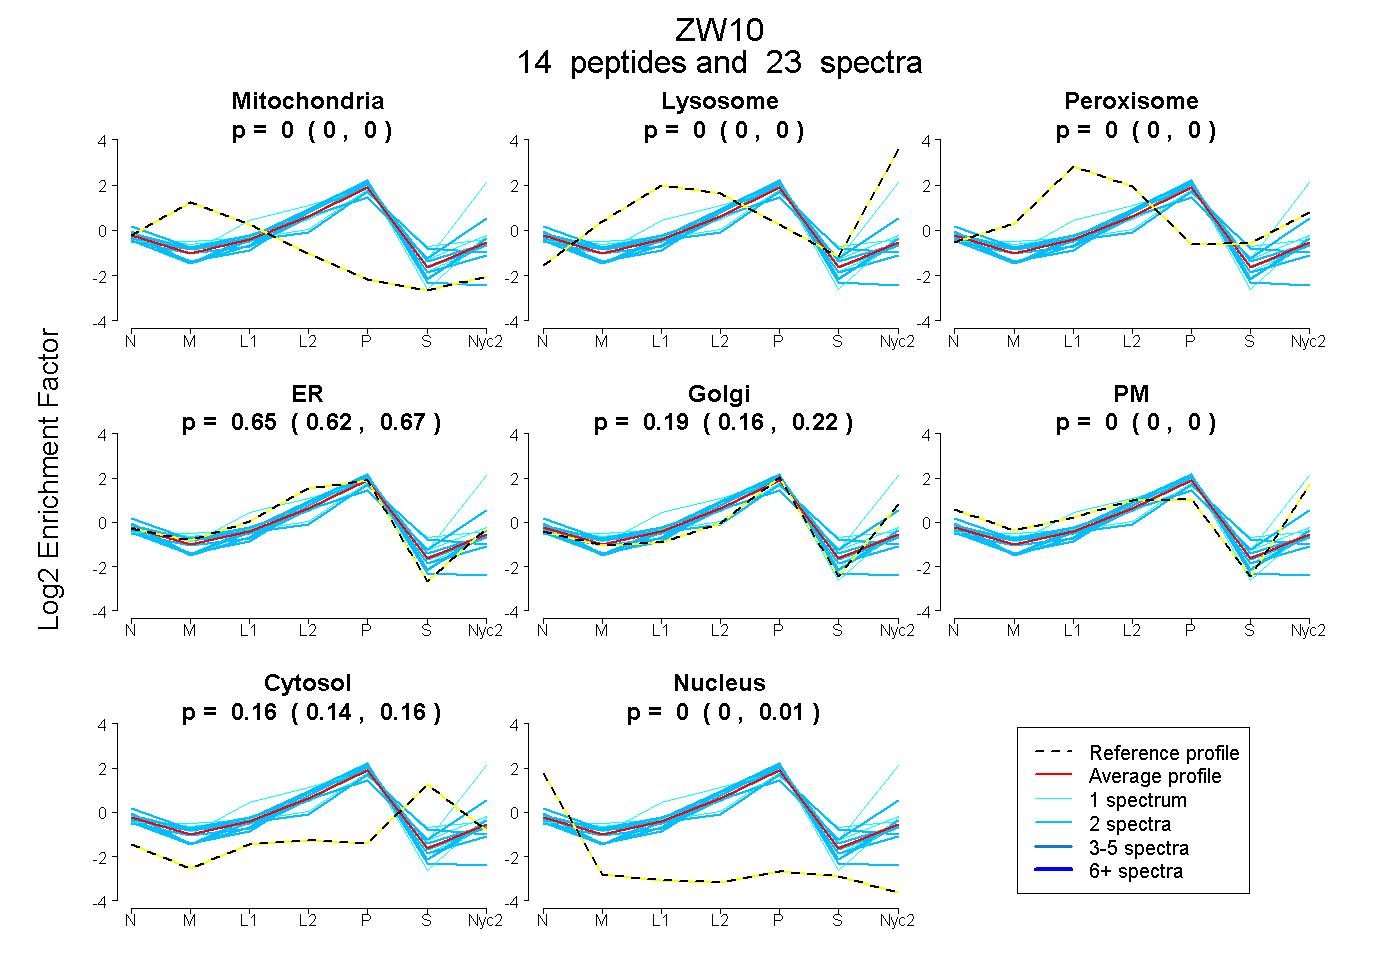
0.000 | 0.000
0.000 | 0.000
0.000 | 0.000
0.621 | 0.671
0.158 | 0.221
0.000 | 0.000
0.145 | 0.164
0.000 | 0.012
4peptides
spectra
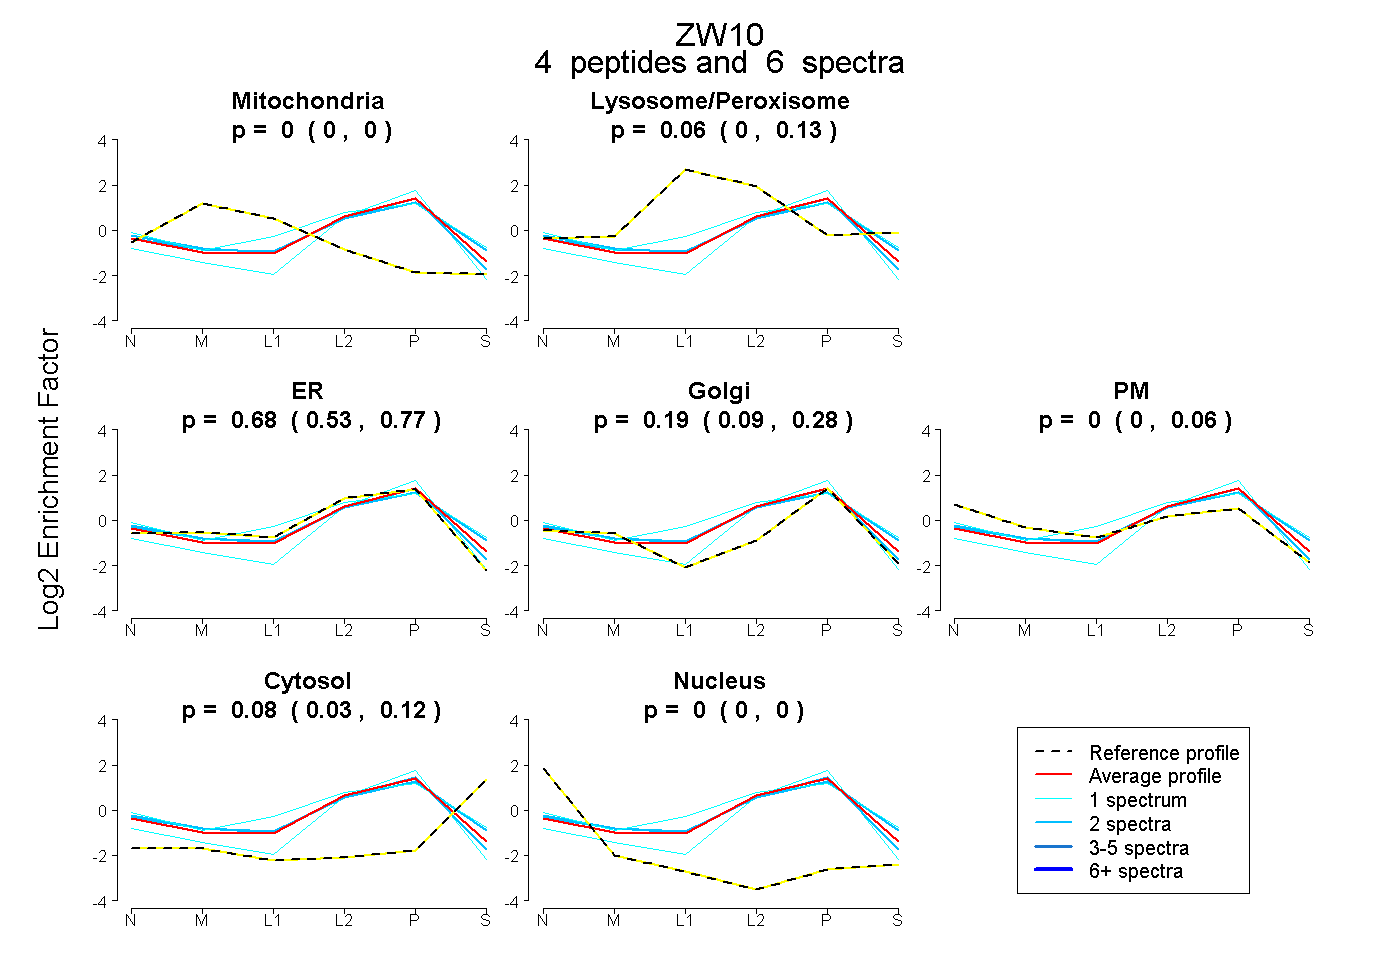
0.000 | 0.000
0.000 | 0.131
0.526 | 0.771
0.095 | 0.277
0.000 | 0.055
0.027 | 0.116
0.000 | 0.000