 14
14peptides
spectra
0.000 | 0.000
0.000 | 0.000
0.000 | 0.000
0.621 | 0.671
0.158 | 0.221
0.000 | 0.000
0.145 | 0.164
0.000 | 0.012
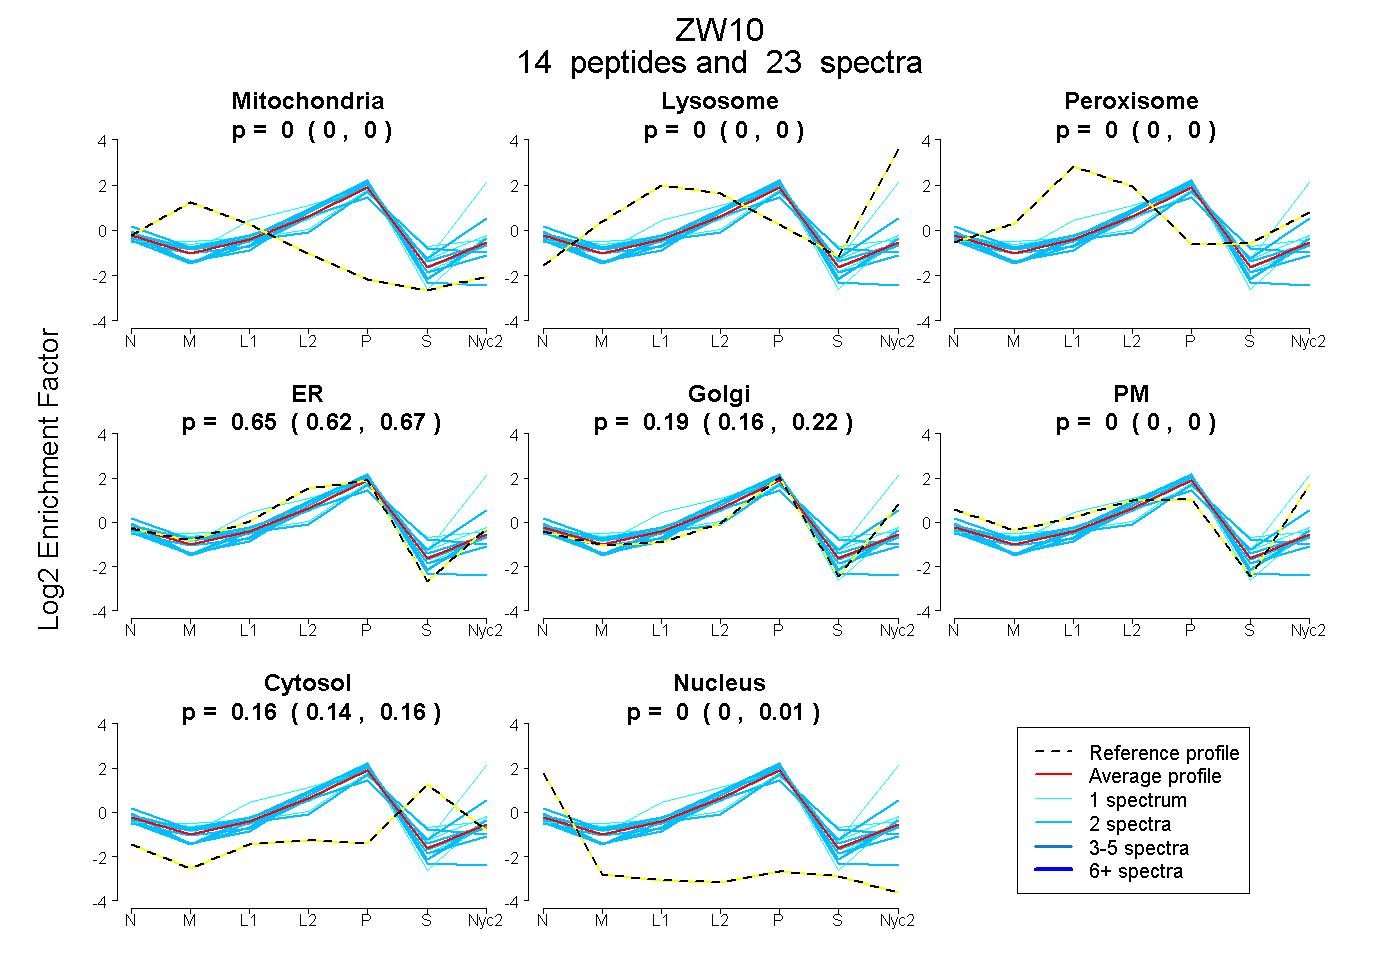
| Plot | Mito | Lyso | Perox | ER | Golgi | PM | Cytosol | Nucleus | |||||
| Expt A |
14 peptides |
23 spectra |
|
0.000 0.000 | 0.000 |
0.000 0.000 | 0.000 |
0.000 0.000 | 0.000 |
0.648 0.621 | 0.671 |
0.193 0.158 | 0.221 |
0.000 0.000 | 0.000 |
0.156 0.145 | 0.164 |
0.003 0.000 | 0.012 |
| 2 spectra, ITALEDISTEDGDR | 0.000 | 0.000 | 0.000 | 0.626 | 0.206 | 0.000 | 0.151 | 0.017 | ||
| 1 spectrum, ALFQNTER | 0.015 | 0.000 | 0.000 | 0.698 | 0.161 | 0.000 | 0.106 | 0.019 | ||
| 2 spectra, NINSHFANK | 0.000 | 0.000 | 0.000 | 0.751 | 0.153 | 0.000 | 0.092 | 0.003 | ||
| 2 spectra, YIPAAR | 0.000 | 0.000 | 0.000 | 0.580 | 0.229 | 0.000 | 0.191 | 0.000 | ||
| 2 spectra, YQEEVPVYVSK | 0.000 | 0.000 | 0.000 | 0.239 | 0.206 | 0.373 | 0.182 | 0.000 | ||
| 1 spectrum, LLEEAQECLK | 0.000 | 0.329 | 0.000 | 0.034 | 0.393 | 0.234 | 0.010 | 0.000 | ||
| 2 spectra, DSVVLNLLK | 0.000 | 0.000 | 0.000 | 0.814 | 0.000 | 0.000 | 0.000 | 0.186 | ||
| 2 spectra, QVLHQLK | 0.000 | 0.000 | 0.000 | 0.573 | 0.348 | 0.000 | 0.057 | 0.021 | ||
| 2 spectra, LQVQVCK | 0.000 | 0.000 | 0.000 | 0.508 | 0.153 | 0.000 | 0.309 | 0.030 | ||
| 1 spectrum, ASFVTEVLAHSGSLEK | 0.026 | 0.000 | 0.049 | 0.296 | 0.472 | 0.000 | 0.157 | 0.000 | ||
| 2 spectra, IETEVCR | 0.000 | 0.000 | 0.000 | 0.851 | 0.000 | 0.000 | 0.100 | 0.049 | ||
| 2 spectra, SFSLPTCR | 0.014 | 0.000 | 0.000 | 0.726 | 0.105 | 0.000 | 0.155 | 0.000 | ||
| 1 spectrum, GEVCNMISK | 0.000 | 0.000 | 0.056 | 0.524 | 0.160 | 0.000 | 0.259 | 0.000 | ||
| 1 spectrum, SFGQMLLK | 0.068 | 0.000 | 0.000 | 0.524 | 0.408 | 0.000 | 0.000 | 0.000 |
| Plot | Mito | Lyso or Perox | ER | Golgi | PM | Cytosol | Nucleus | ||||||
| Expt B |
4 peptides |
6 spectra |
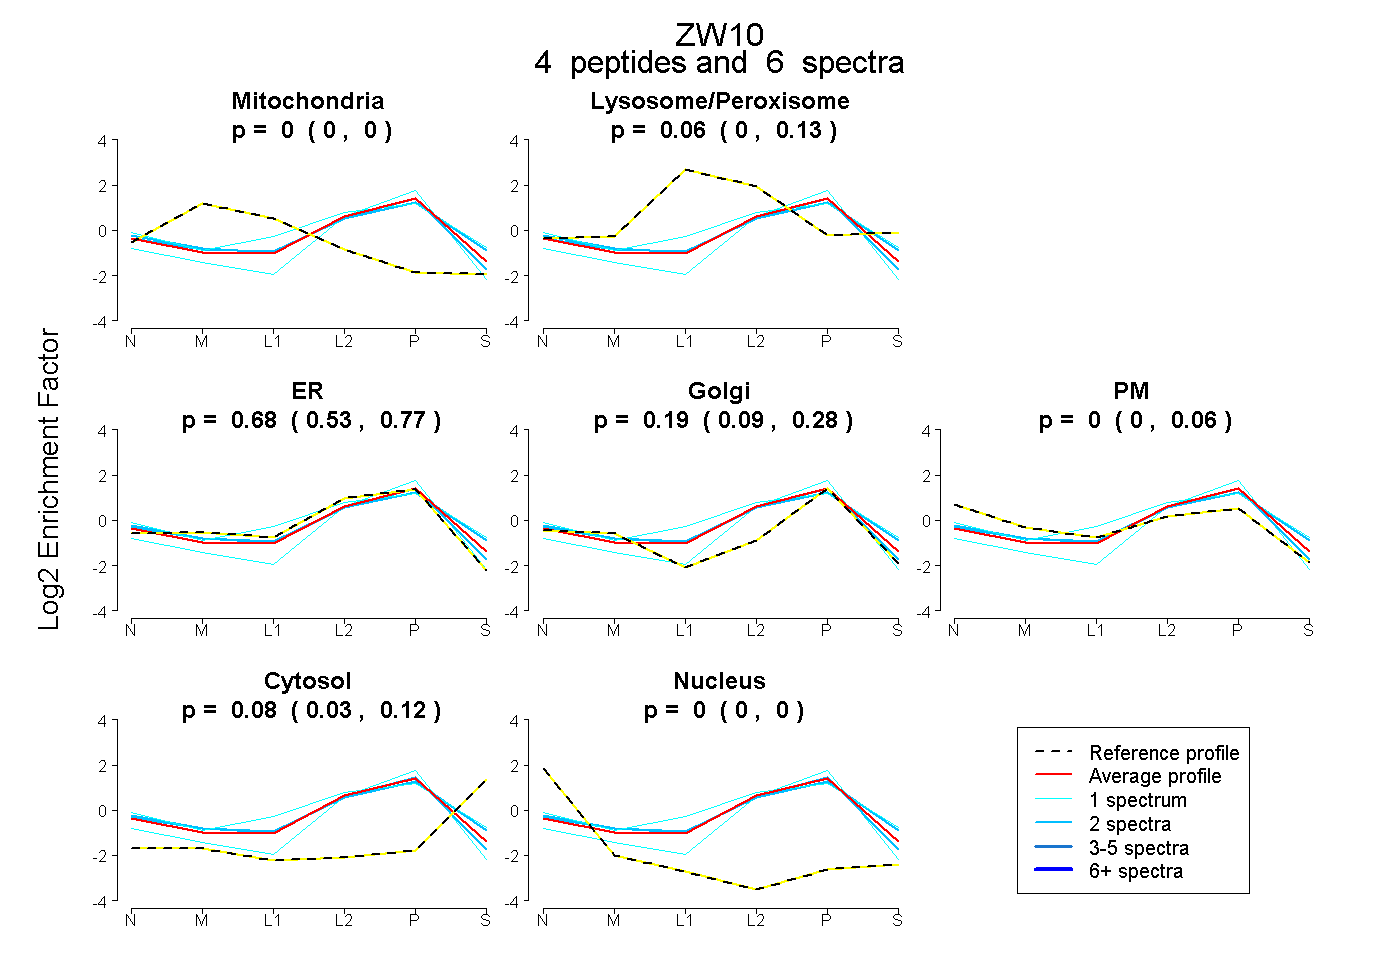 |
0.000 0.000 | 0.000 |
0.059 0.000 | 0.131 |
0.677 0.526 | 0.771 |
0.185 0.095 | 0.277 |
0.000 0.000 | 0.055 |
0.078 0.027 | 0.116 |
0.000 0.000 | 0.000 |
|||
| Plot | Lyso | Other | |||||||||||
| Expt C |
11 peptides |
18 spectra |
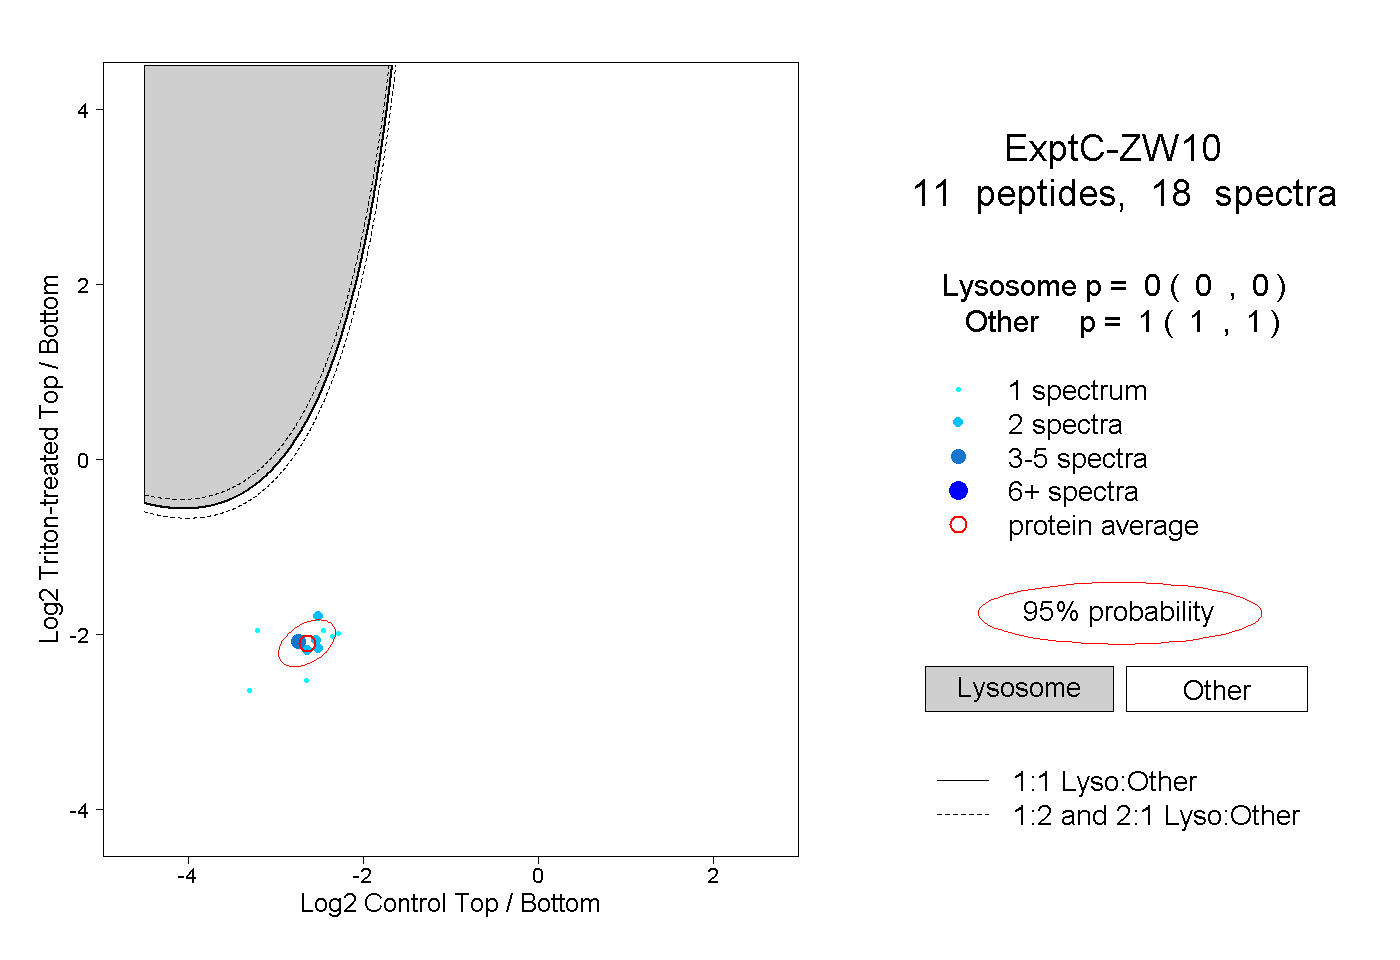 |
0.000 0.000 | 0.000 |
1.000 1.000 | 1.000 |
||||||||
| Plot | Lyso | Other | |||||||||||
| Expt D |
3 peptides |
8 spectra |
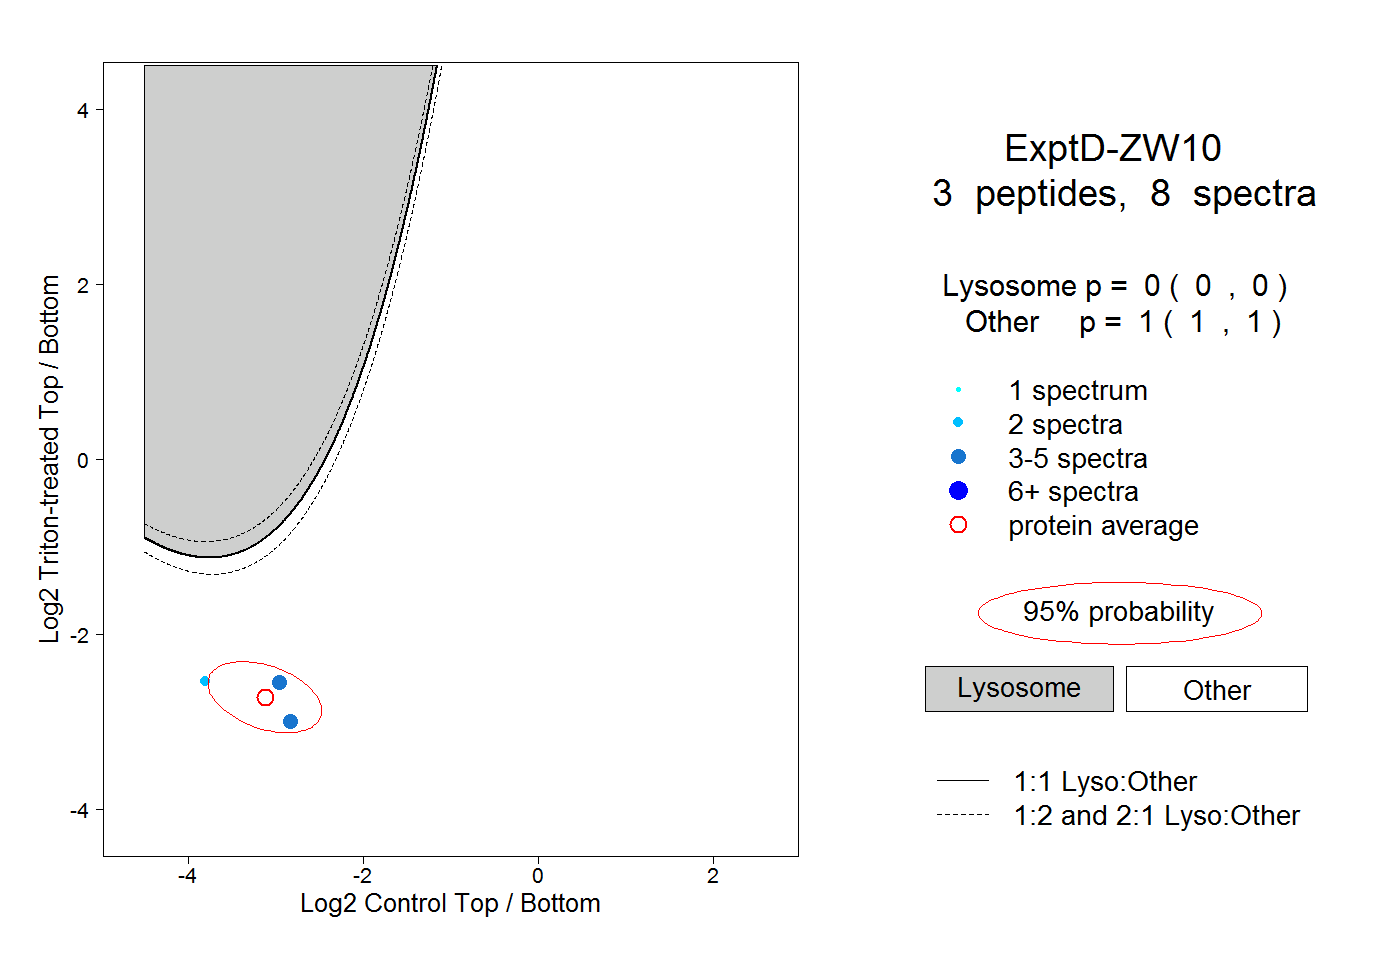 |
0.000 0.000 | 0.000 |
1.000 1.000 | 1.000 |