14
14peptides
spectra
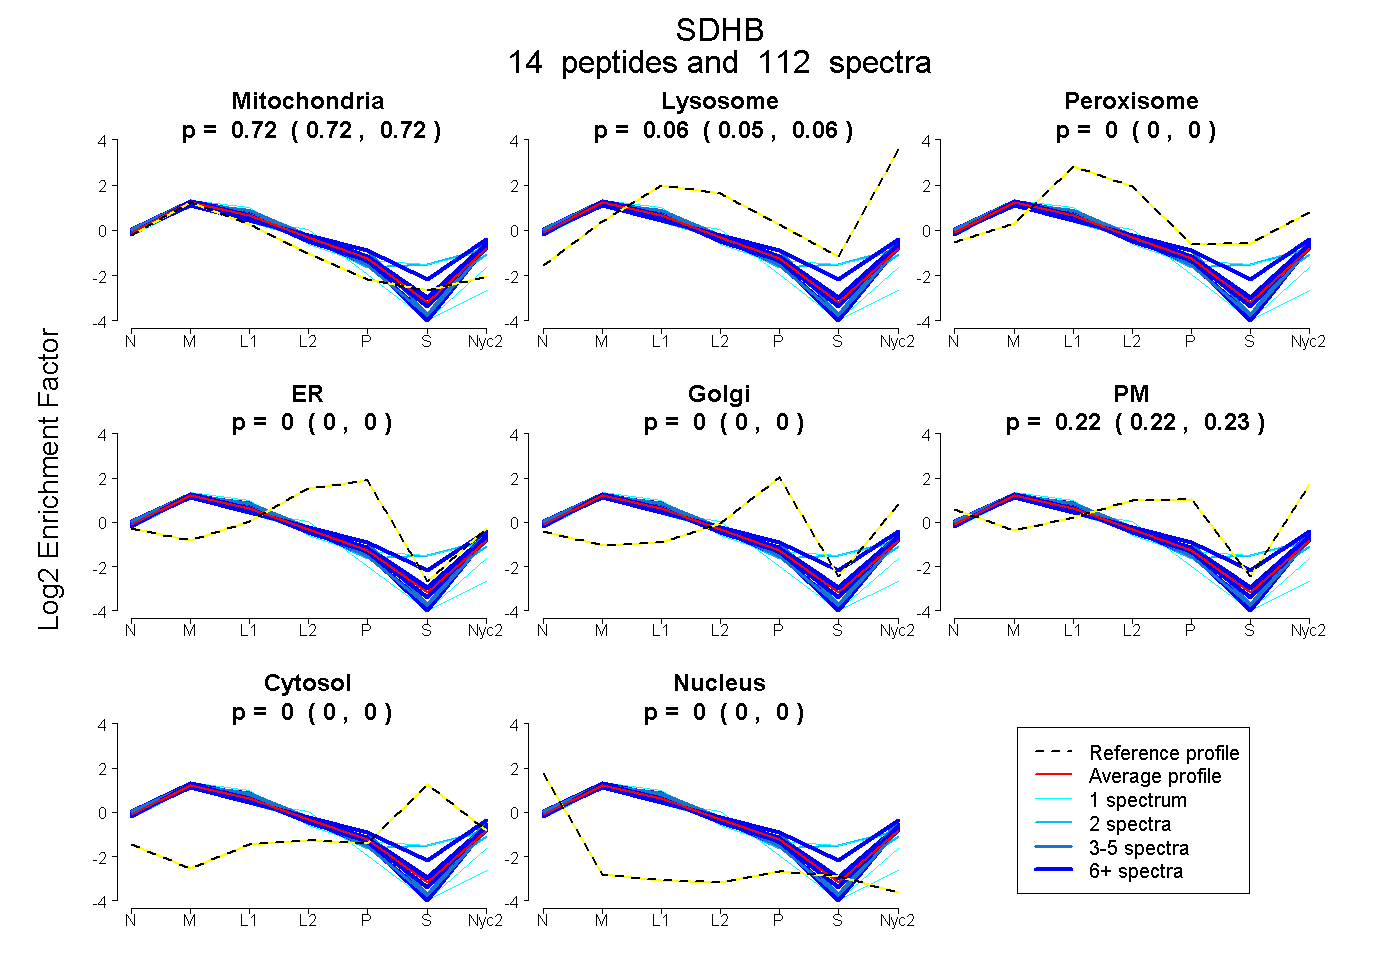
0.716 | 0.721
0.054 | 0.062
0.000 | 0.000
0.000 | 0.000
0.000 | 0.000
0.219 | 0.227
0.000 | 0.000
0.000 | 0.000
12peptides
spectra
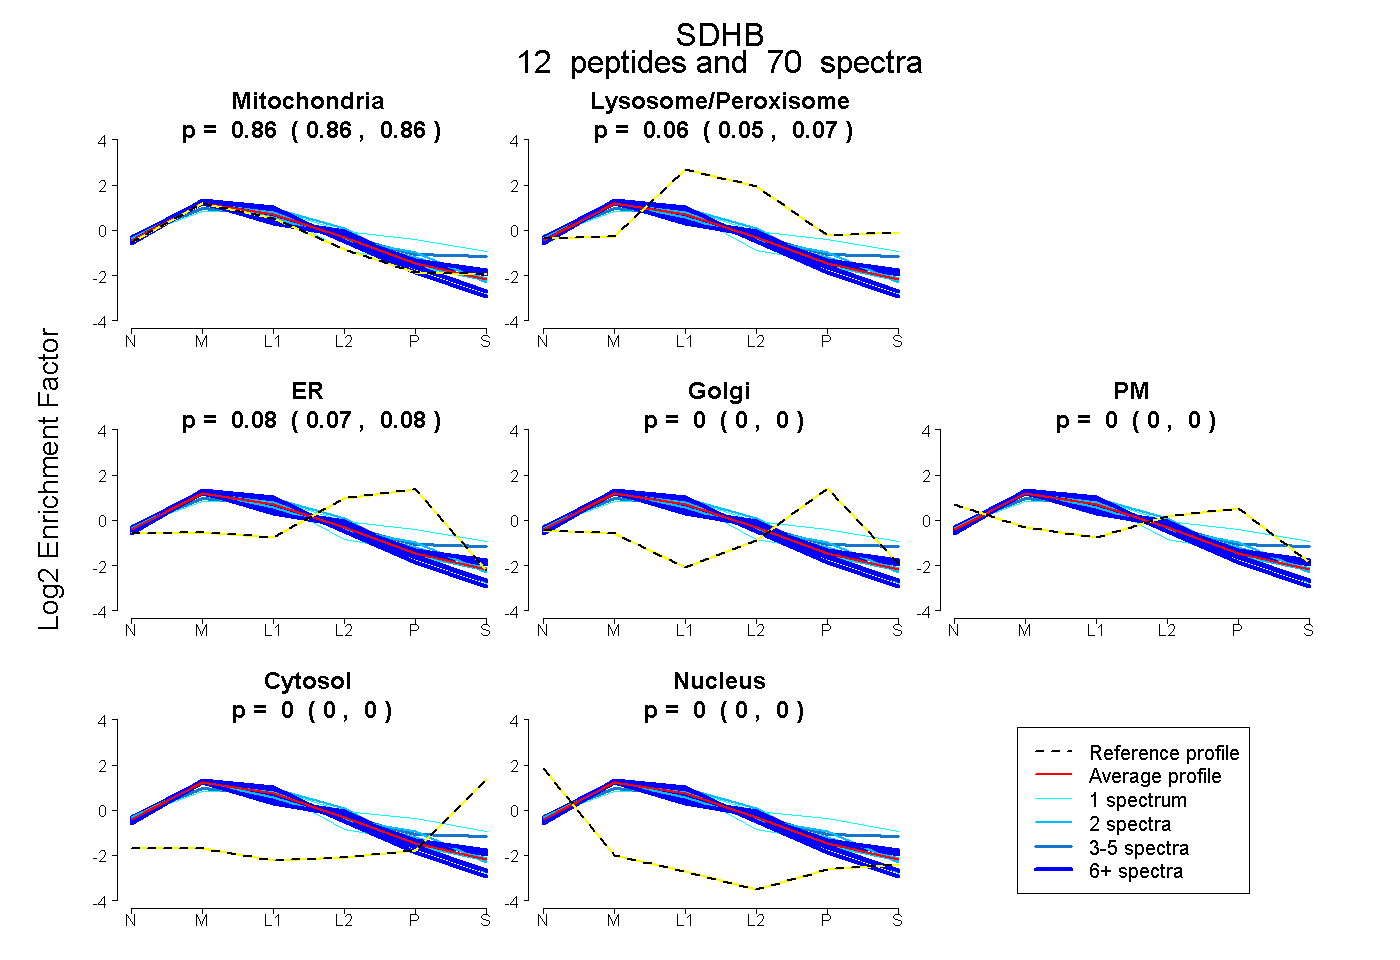
0.856 | 0.865
0.055 | 0.066
0.072 | 0.083
0.000 | 0.000
0.000 | 0.000
0.000 | 0.000
0.000 | 0.000
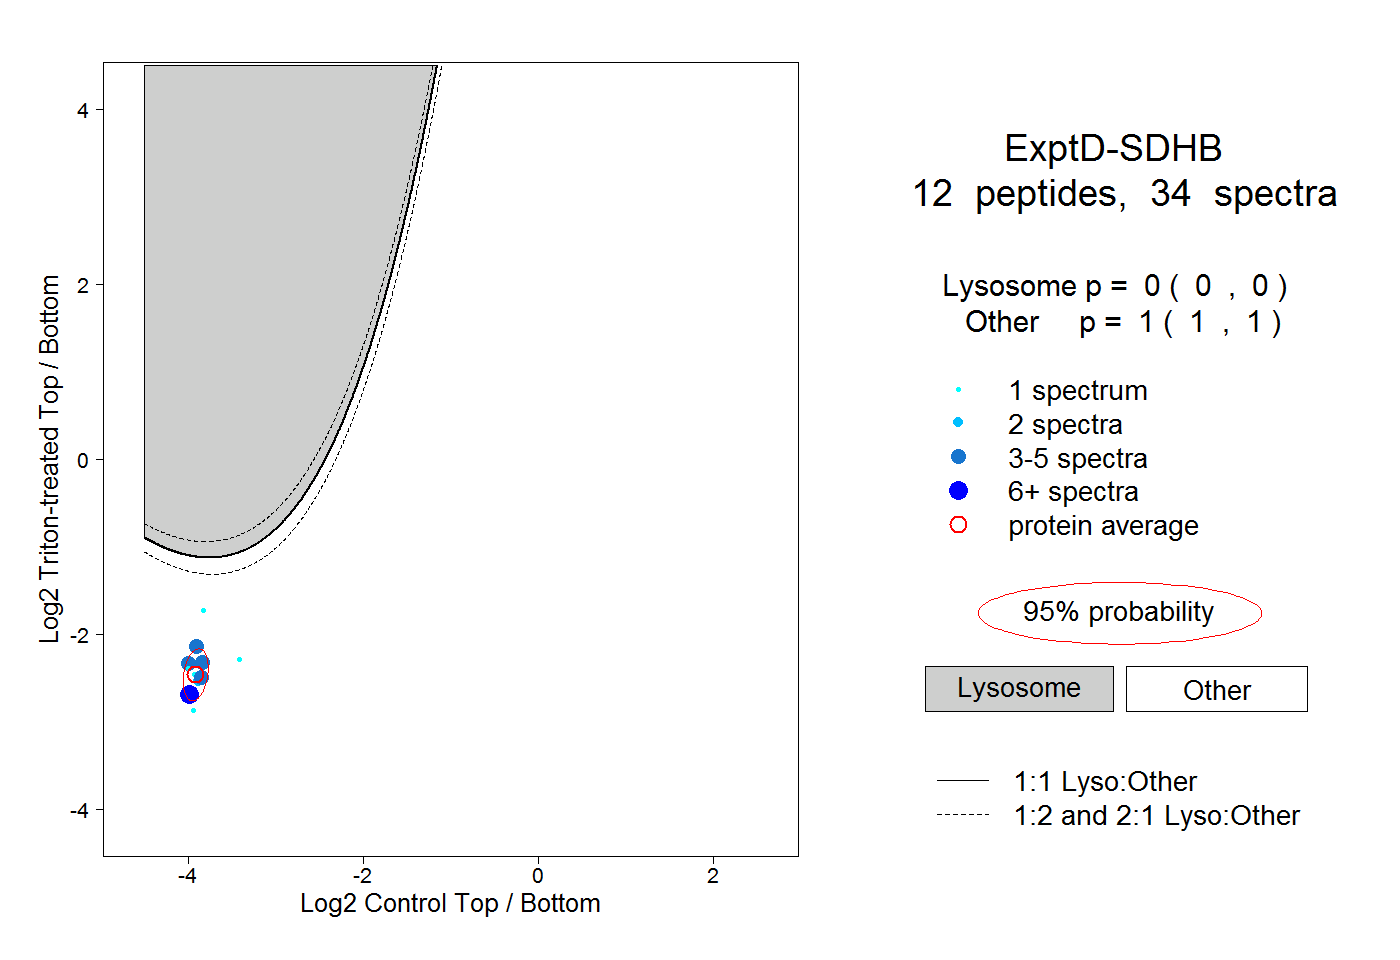
18peptides
spectra
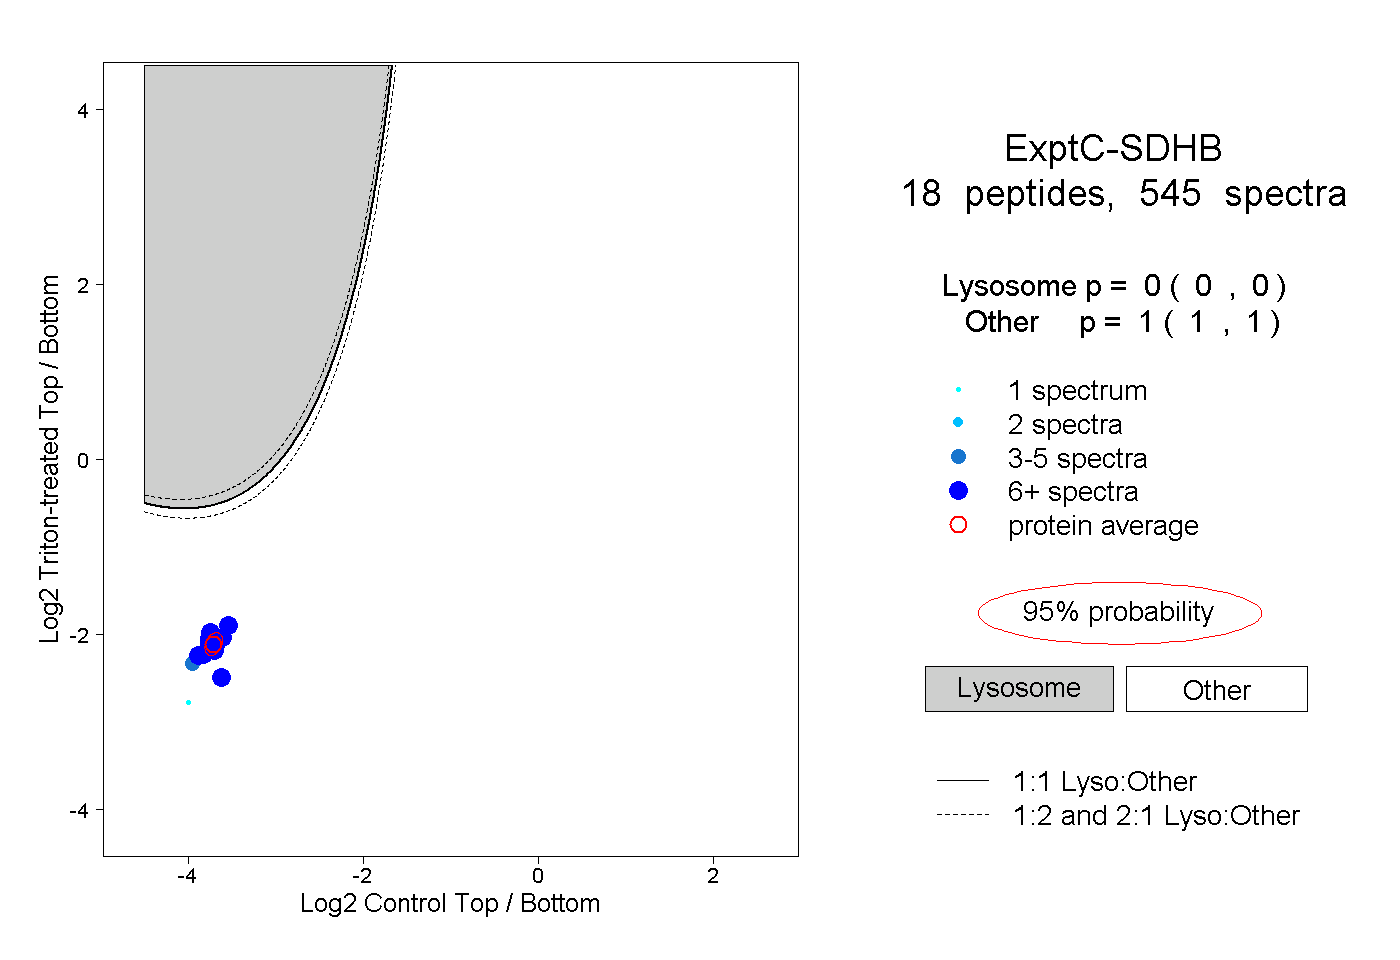
0.000 | 0.000
1.000 | 1.000