17
17peptides
spectra
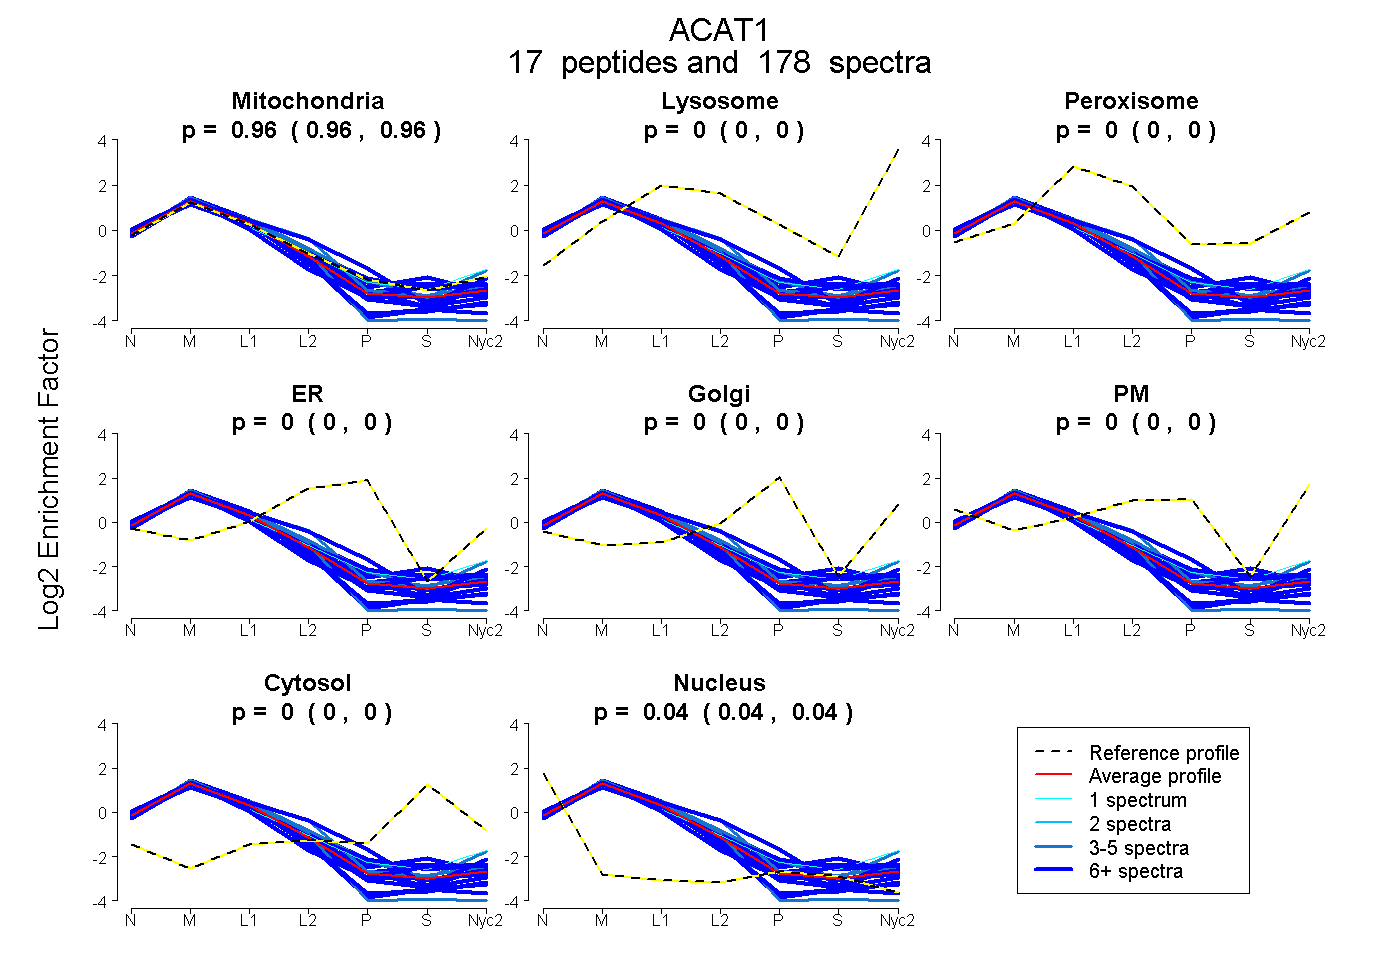
0.960 | 0.962
0.000 | 0.000
0.000 | 0.000
0.000 | 0.000
0.000 | 0.000
0.000 | 0.000
0.000 | 0.000
0.038 | 0.040
18peptides
spectra
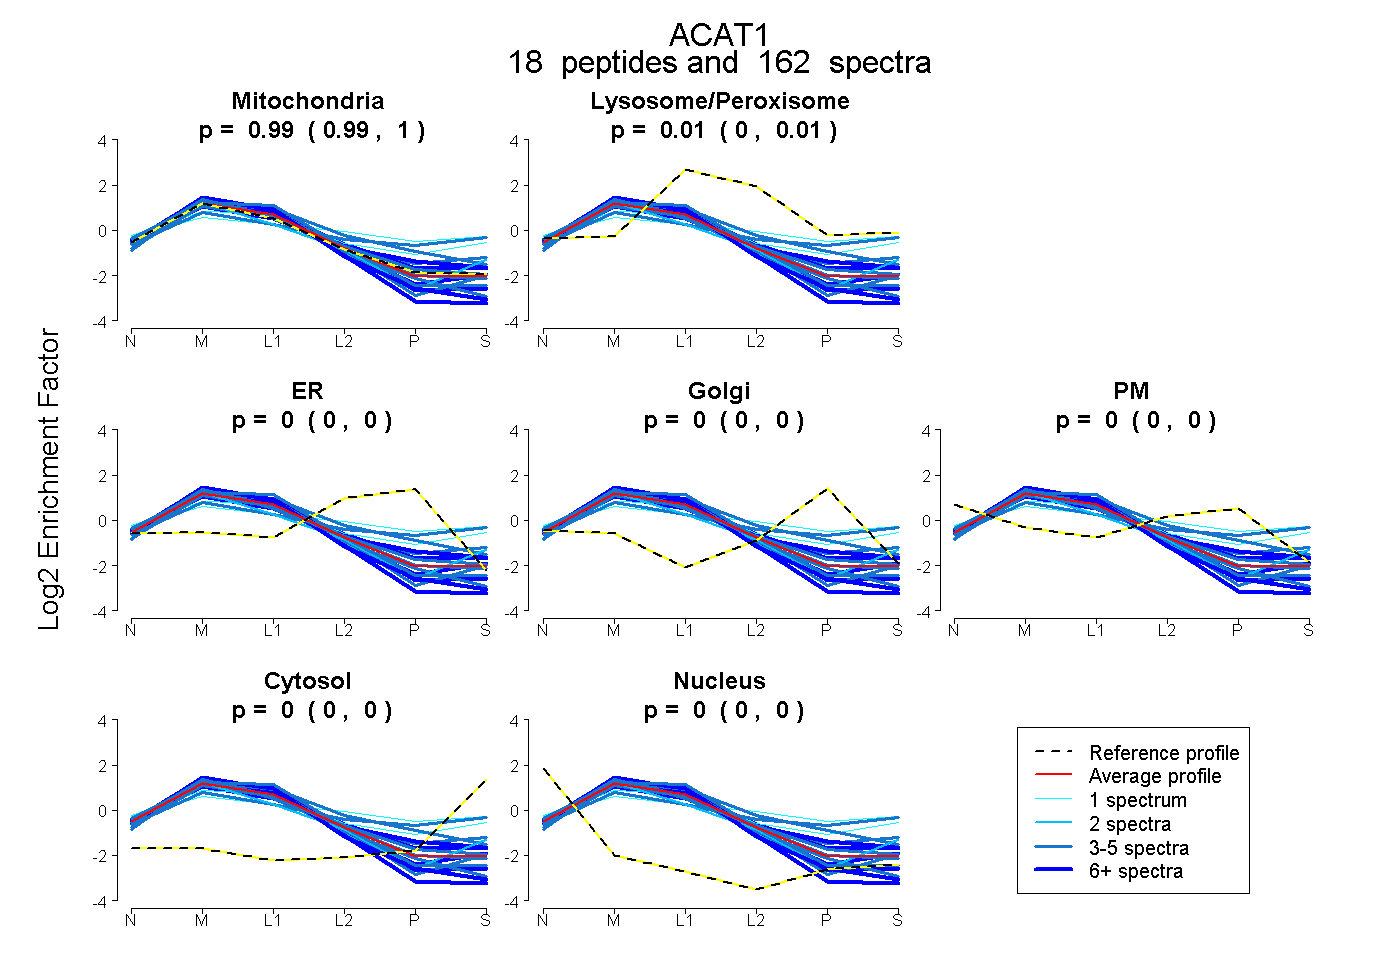
0.990 | 0.997
0.002 | 0.010
0.000 | 0.000
0.000 | 0.000
0.000 | 0.000
0.000 | 0.000
0.000 | 0.000
17peptides
spectra
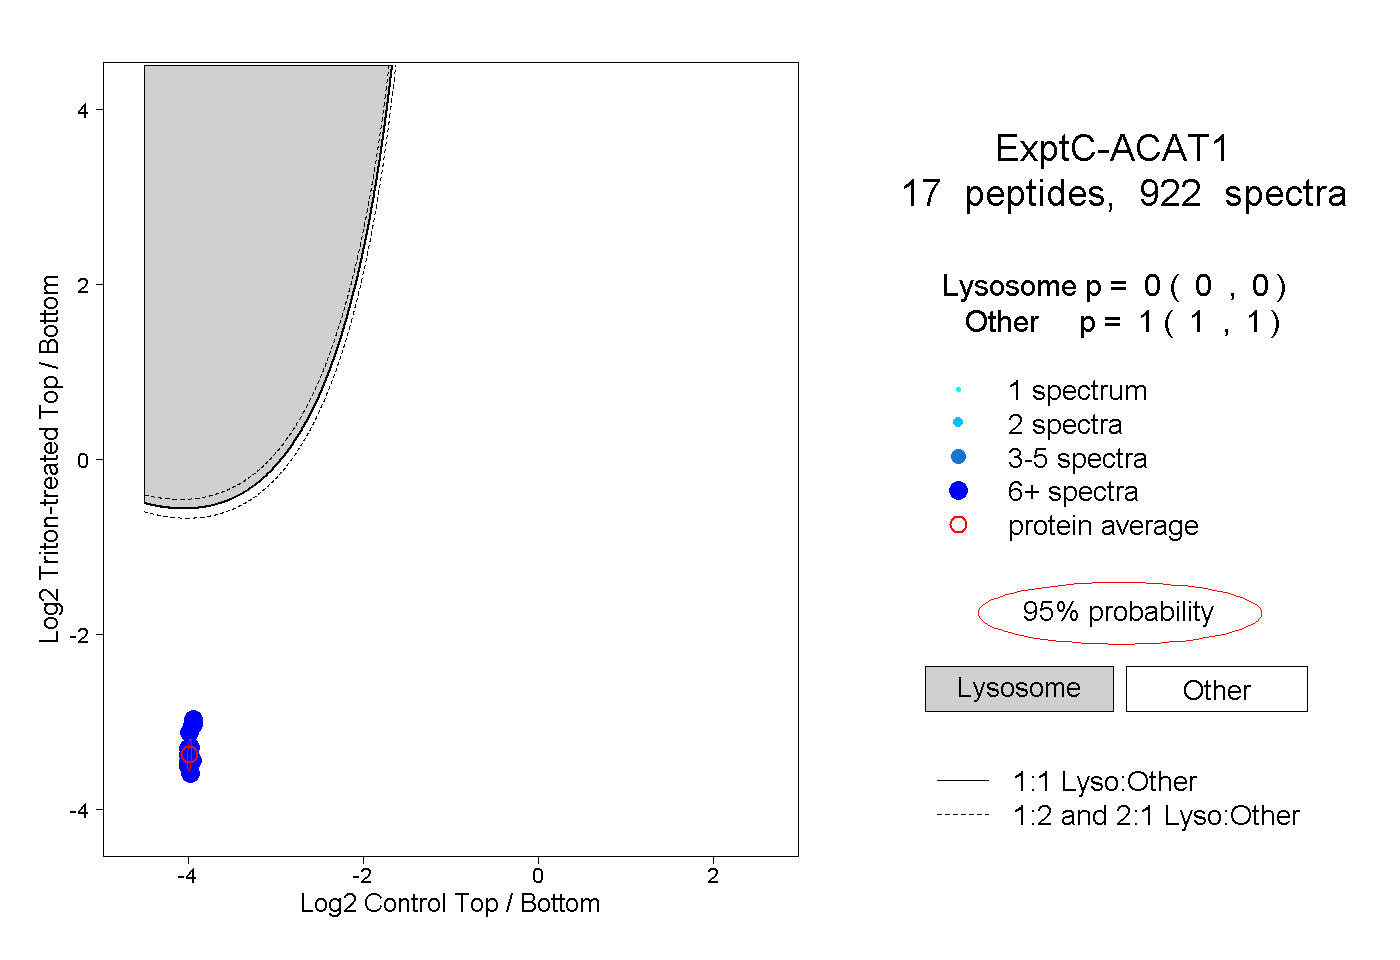
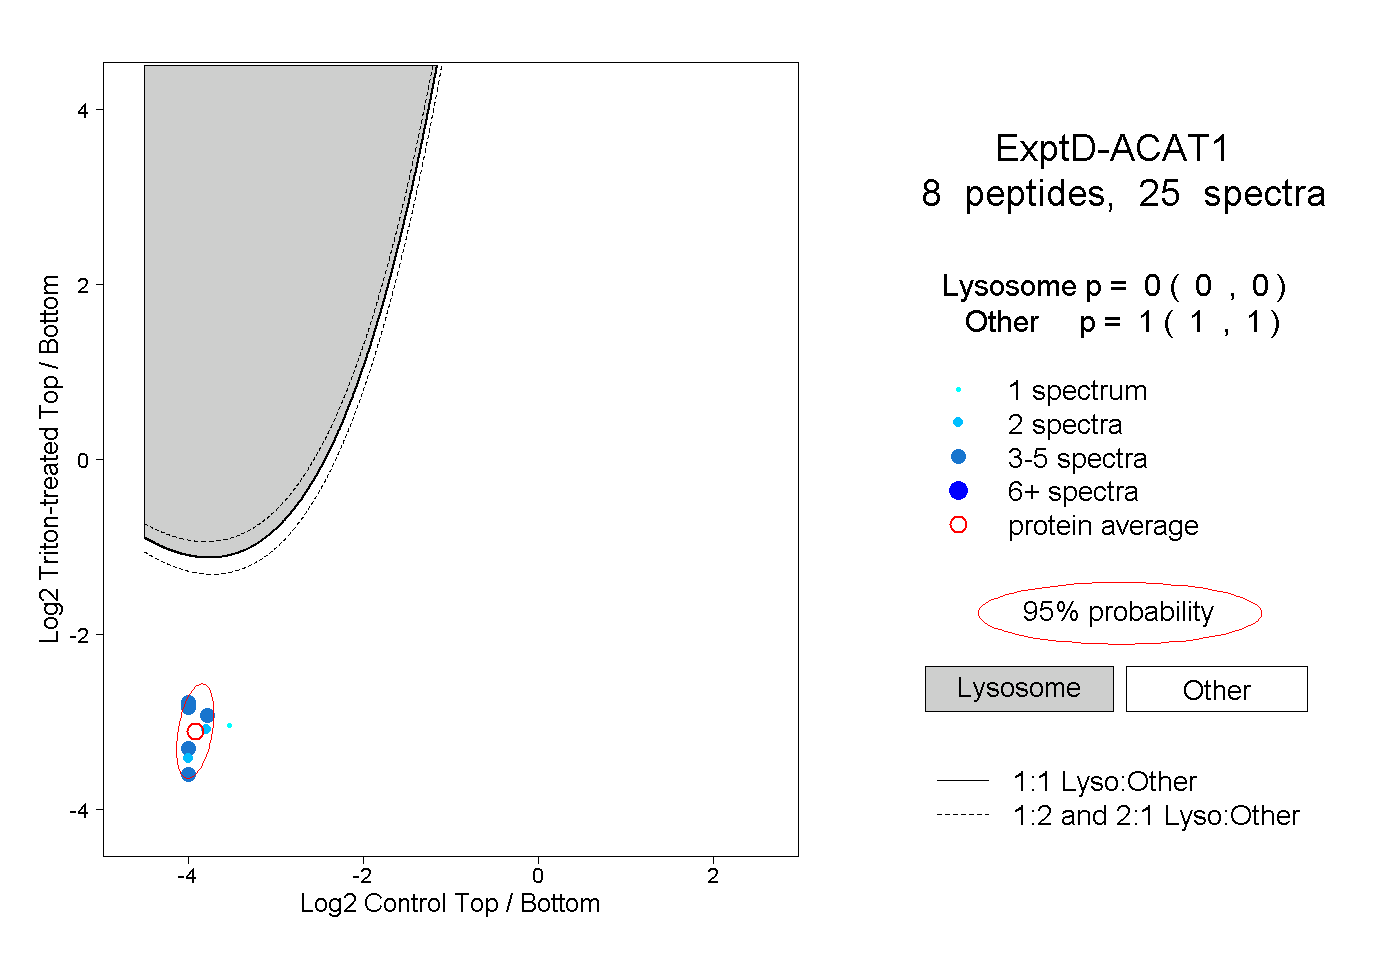
0.000 | 0.000
1.000 | 1.000