 5
5peptides
spectra
0.000 | 0.000
0.000 | 0.030
0.029 | 0.094
0.000 | 0.000
0.528 | 0.642
0.094 | 0.212
0.147 | 0.204
0.000 | 0.000
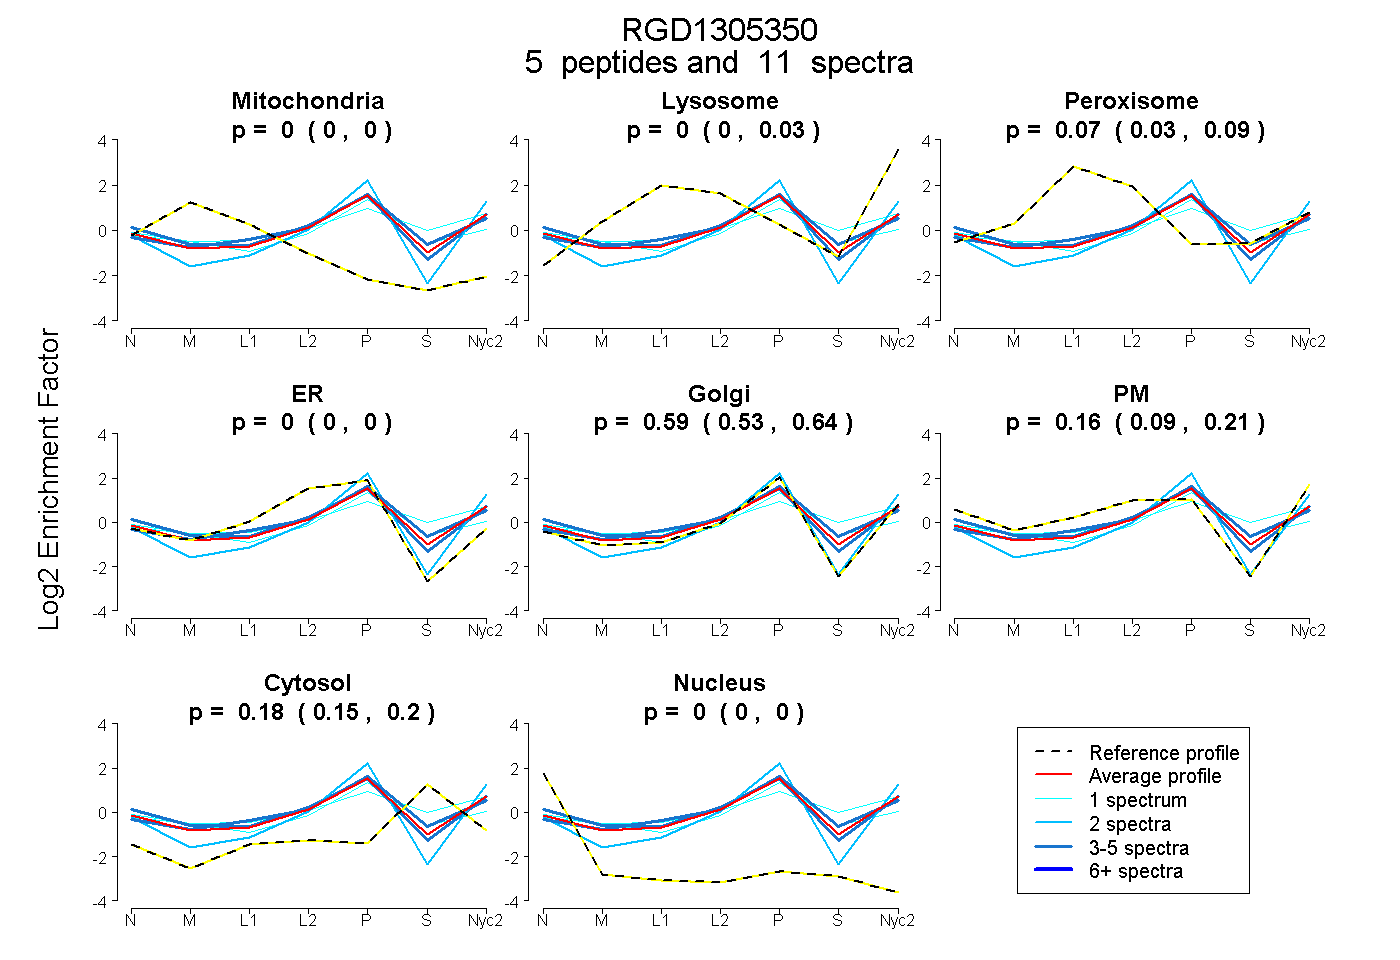
| Plot | Mito | Lyso | Perox | ER | Golgi | PM | Cytosol | Nucleus | |||||
| Expt A |
5 peptides |
11 spectra |
|
0.000 0.000 | 0.000 |
0.000 0.000 | 0.030 |
0.071 0.029 | 0.094 |
0.000 0.000 | 0.000 |
0.591 0.528 | 0.642 |
0.160 0.094 | 0.212 |
0.178 0.147 | 0.204 |
0.000 0.000 | 0.000 |
| 2 spectra, IQLNNPTER | 0.000 | 0.000 | 0.000 | 0.000 | 1.000 | 0.000 | 0.000 | 0.000 | ||
| 1 spectrum, DCVLLQEDFLAHR | 0.014 | 0.000 | 0.082 | 0.058 | 0.577 | 0.012 | 0.256 | 0.000 | ||
| 4 spectra, GRPHVYLQR | 0.000 | 0.000 | 0.025 | 0.028 | 0.479 | 0.321 | 0.147 | 0.000 | ||
| 1 spectrum, AAGGLHLPSWAR | 0.000 | 0.088 | 0.108 | 0.000 | 0.316 | 0.172 | 0.316 | 0.000 | ||
| 3 spectra, SEPGAAEPSACLEAATR | 0.000 | 0.000 | 0.182 | 0.000 | 0.643 | 0.000 | 0.174 | 0.000 |
| Plot | Lyso | Other | |||||||||||
| Expt C |
4 peptides |
7 spectra |
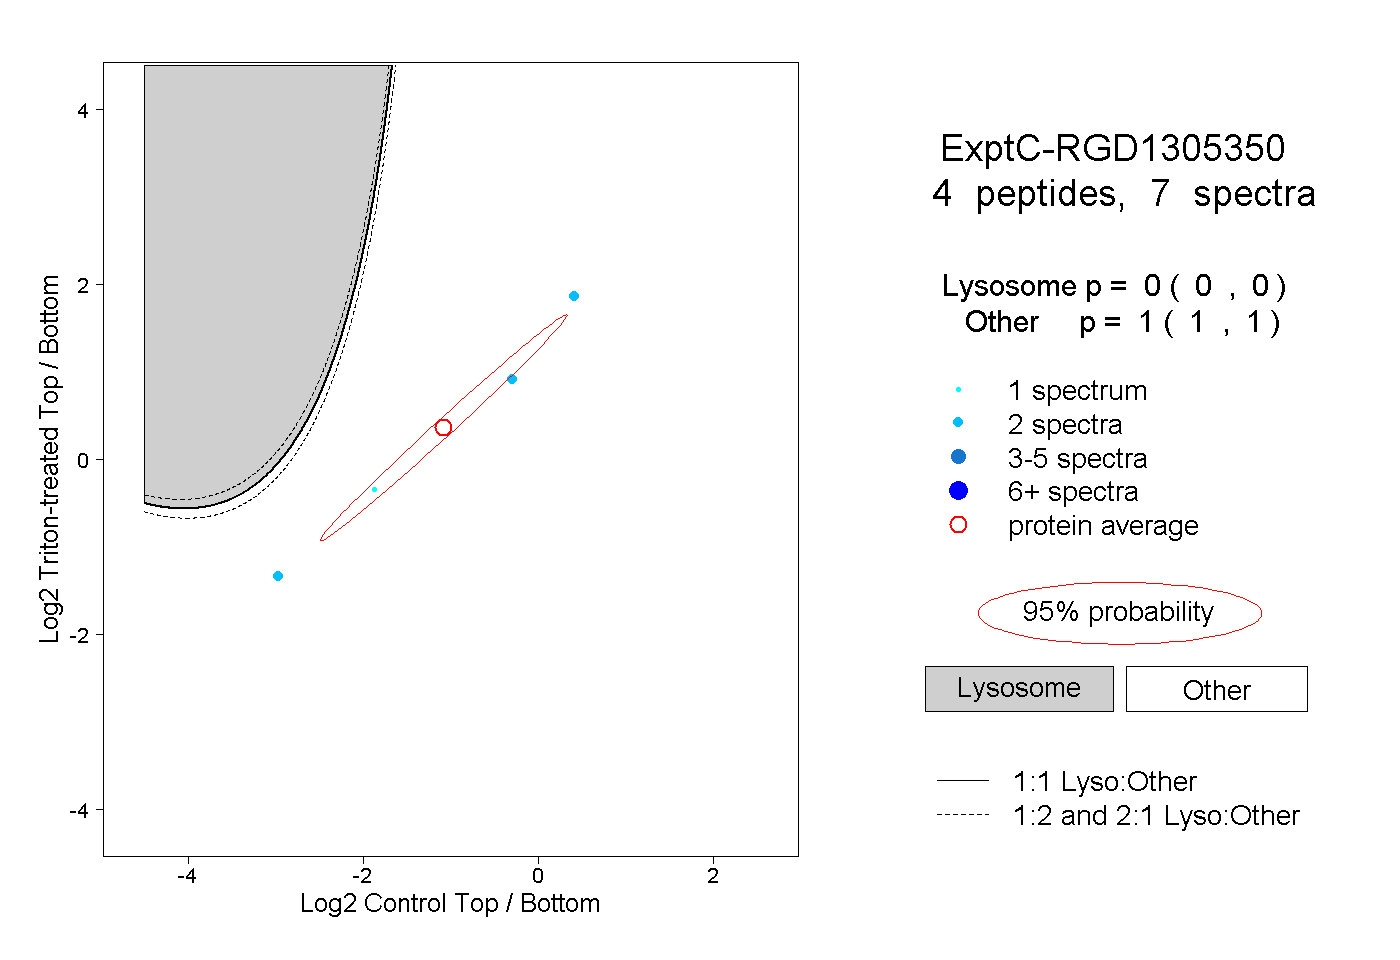 |
0.000 0.000 | 0.000 |
1.000 1.000 | 1.000 |
||||||||
| Plot | Lyso | Other | |||||||||||
| Expt D |
1 peptide |
2 spectra |
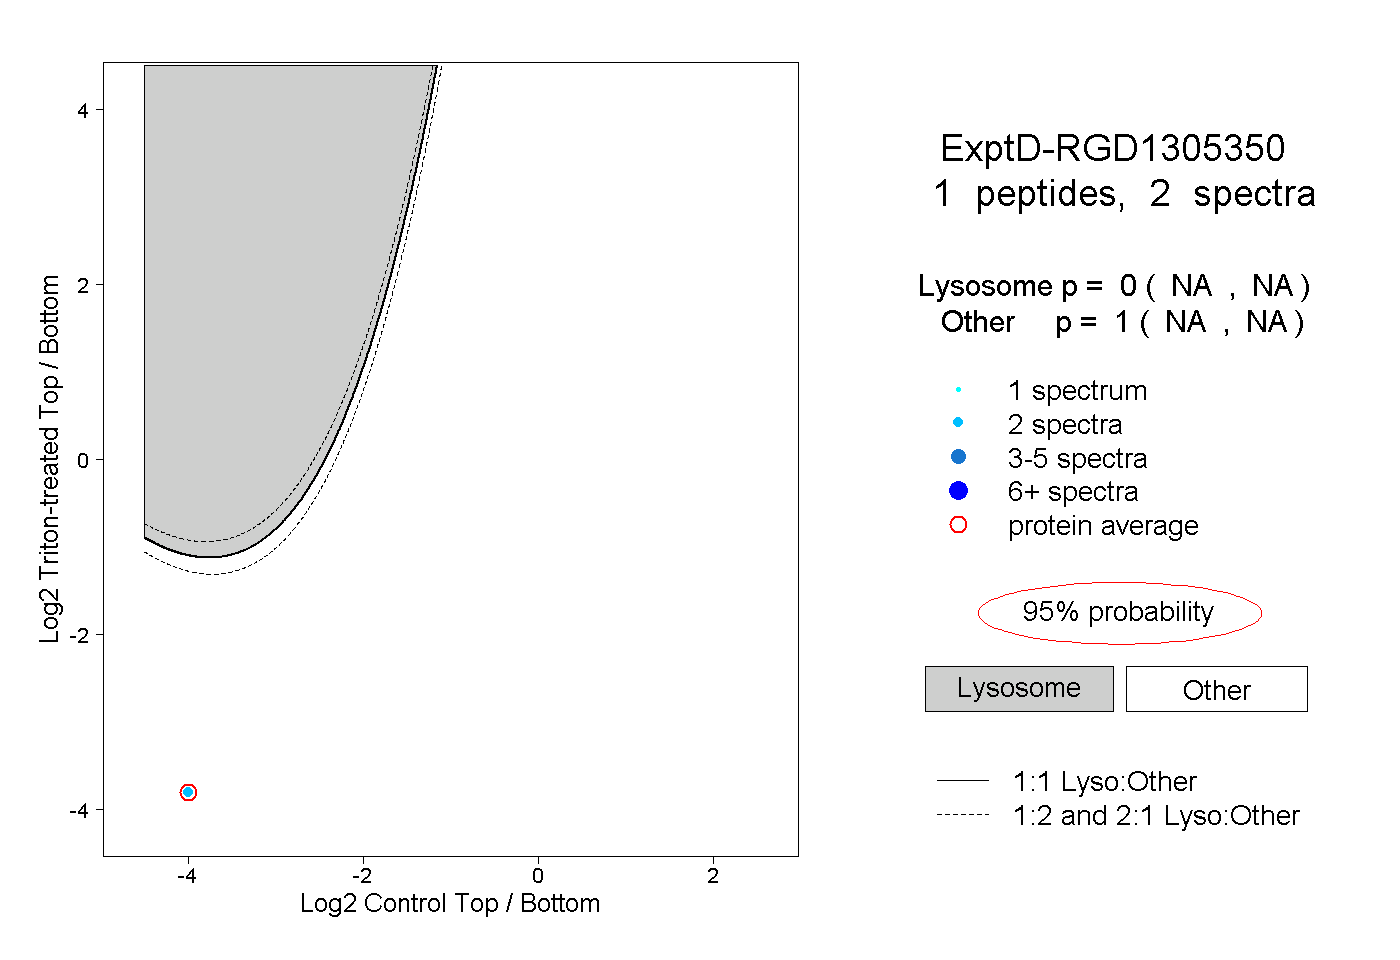 |
0.000 NA | NA |
1.000 NA | NA |