 2
2peptides
spectra
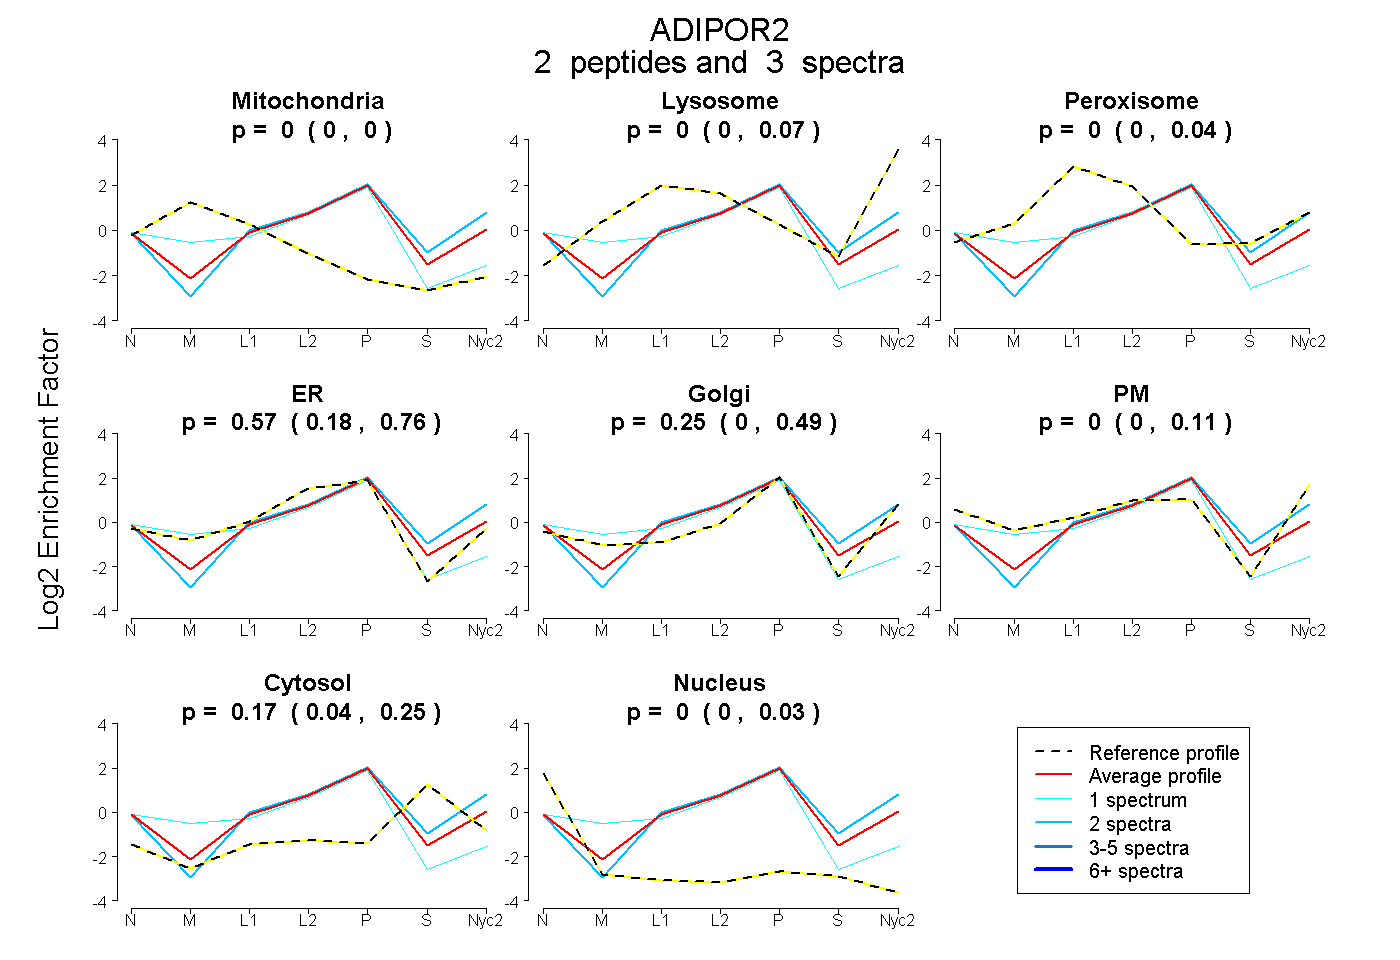
0.000 | 0.000
0.000 | 0.070
0.000 | 0.043
0.176 | 0.765
0.000 | 0.492
0.000 | 0.108
0.041 | 0.255
0.000 | 0.030
| Plot | Mito | Lyso | Perox | ER | Golgi | PM | Cytosol | Nucleus | |||||
| Expt A |
2 peptides |
3 spectra |
|
0.000 0.000 | 0.000 |
0.000 0.000 | 0.070 |
0.000 0.000 | 0.043 |
0.573 0.176 | 0.765 |
0.254 0.000 | 0.492 |
0.000 0.000 | 0.108 |
0.173 0.041 | 0.255 |
0.000 0.000 | 0.030 |
| 1 spectrum, VIPHDVLPDWLK | 0.059 | 0.000 | 0.000 | 0.840 | 0.000 | 0.000 | 0.000 | 0.101 | ||
| 2 spectra, MEEFVCK | 0.000 | 0.059 | 0.000 | 0.336 | 0.391 | 0.003 | 0.210 | 0.000 |