 2
2peptides
spectra
0.000 | 0.000
0.000 | 0.000
0.057 | 0.188
0.334 | 0.577
0.036 | 0.242
0.000 | 0.122
0.178 | 0.254
0.000 | 0.000
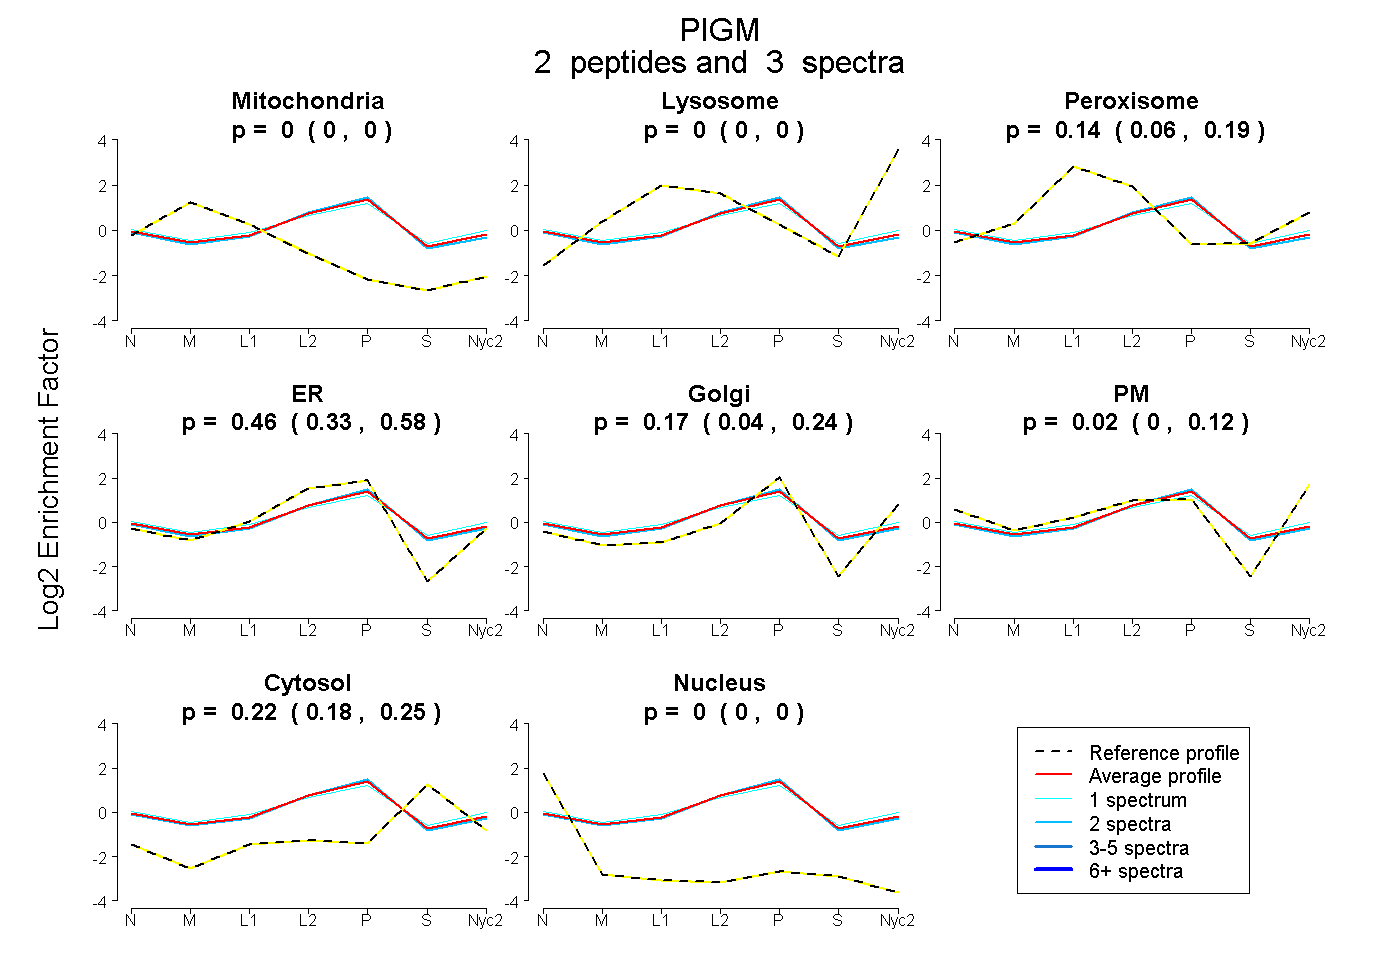
| Plot | Mito | Lyso | Perox | ER | Golgi | PM | Cytosol | Nucleus | |||||
| Expt A |
2 peptides |
3 spectra |
|
0.000 0.000 | 0.000 |
0.000 0.000 | 0.000 |
0.138 0.057 | 0.188 |
0.460 0.334 | 0.577 |
0.165 0.036 | 0.242 |
0.020 0.000 | 0.122 |
0.217 0.178 | 0.254 |
0.000 0.000 | 0.000 |
| 2 spectra, YTDIDYHVFTDAAR | 0.000 | 0.000 | 0.105 | 0.538 | 0.137 | 0.000 | 0.220 | 0.000 | ||
| 1 spectrum, HWGEWFLNLR | 0.000 | 0.000 | 0.187 | 0.313 | 0.186 | 0.096 | 0.217 | 0.000 |