 9
9peptides
spectra
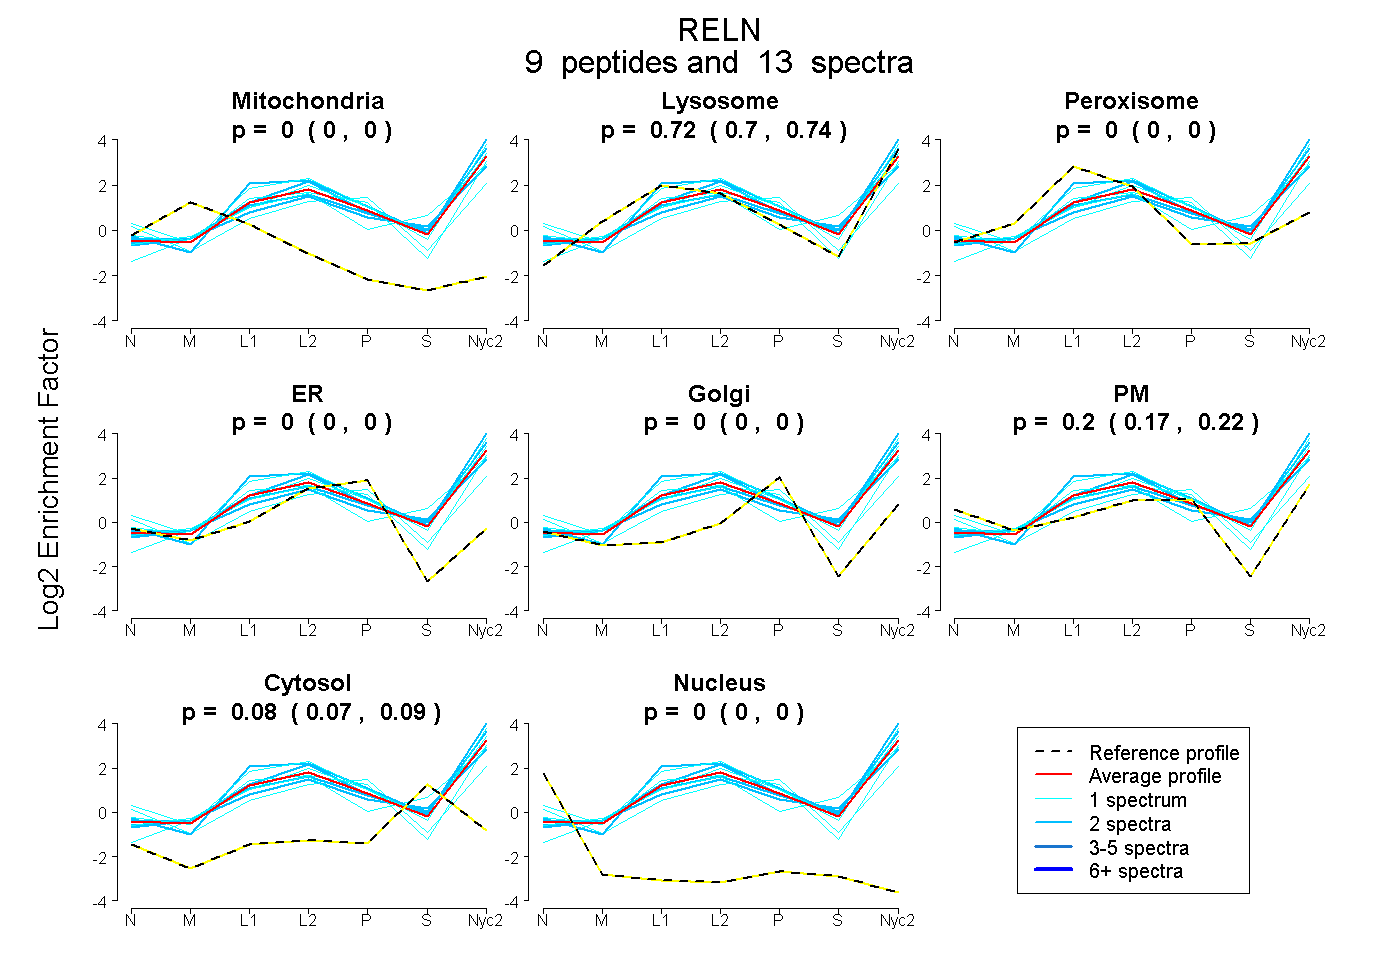
0.000 | 0.000
0.696 | 0.736
0.000 | 0.000
0.000 | 0.000
0.000 | 0.000
0.175 | 0.221
0.069 | 0.092
0.000 | 0.000
17peptides
spectra
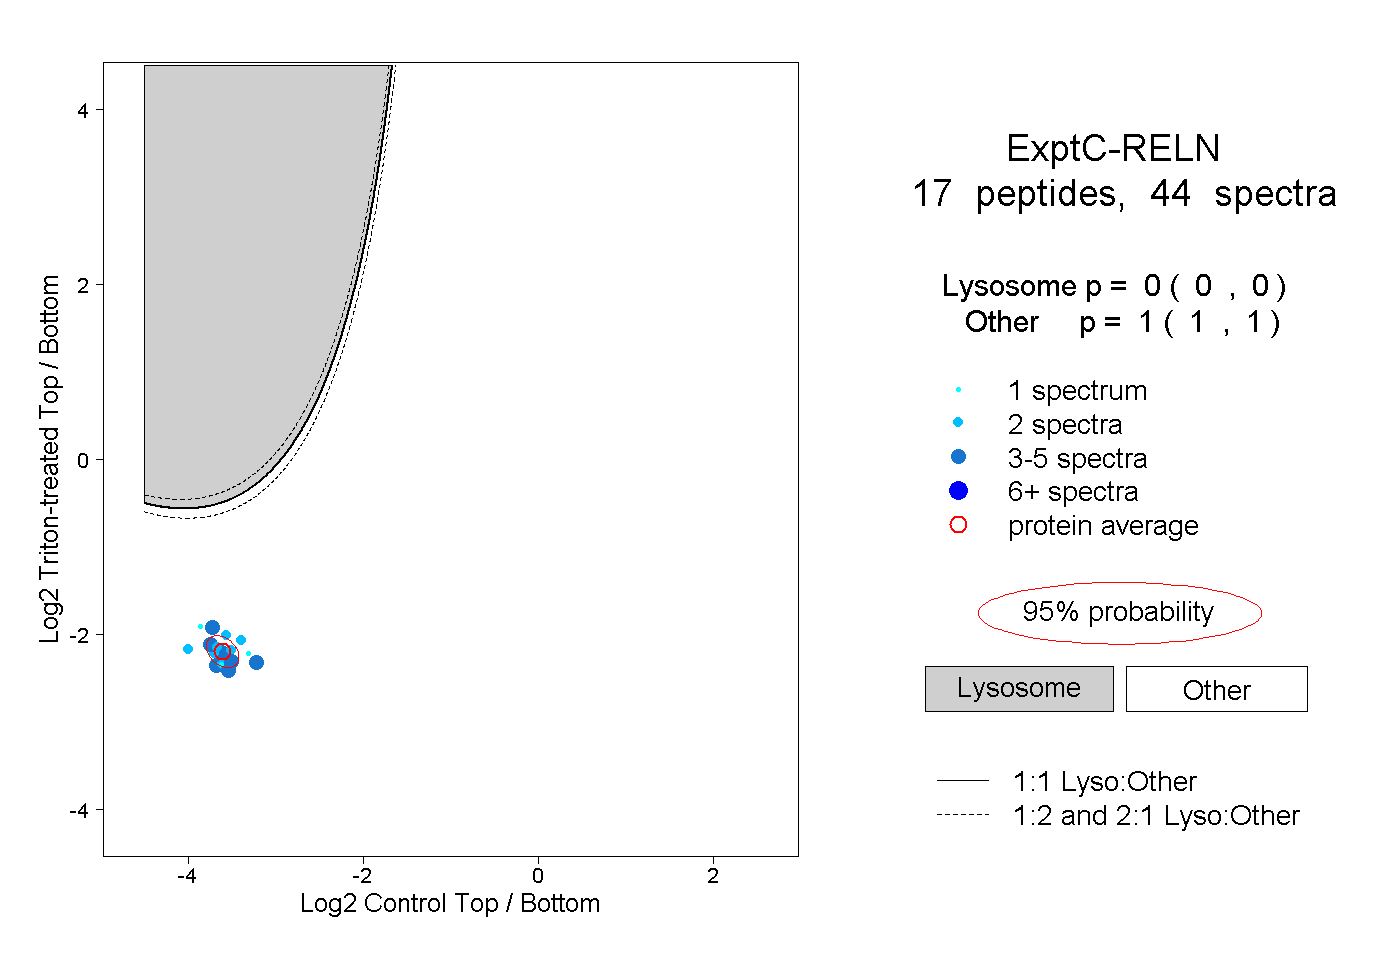
0.000 | 0.000
1.000 | 1.000
3peptides
spectra
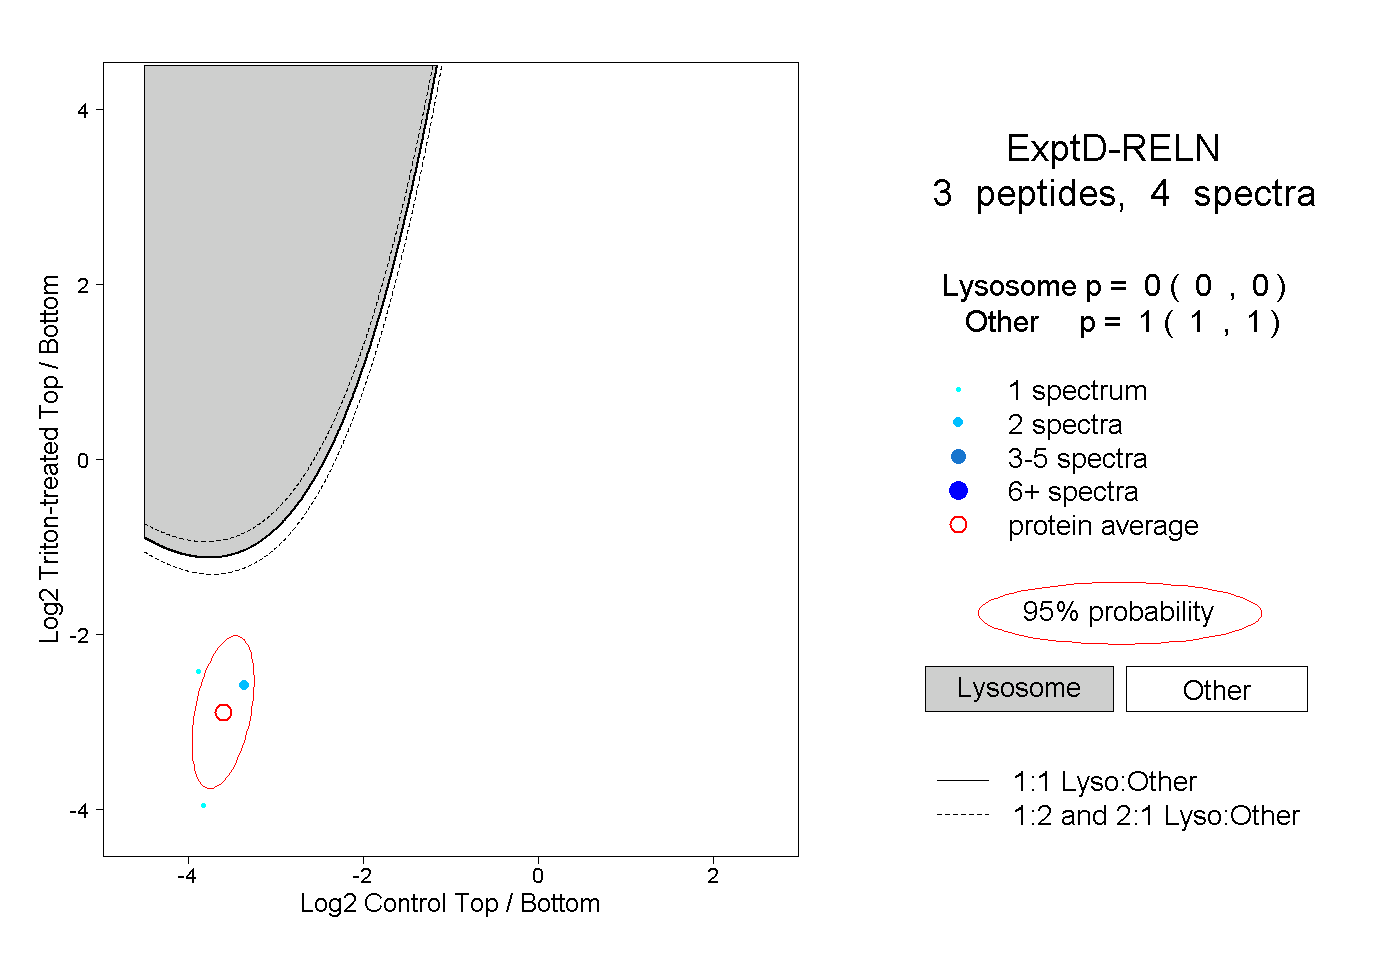
0.000 | 0.000
1.000 | 1.000