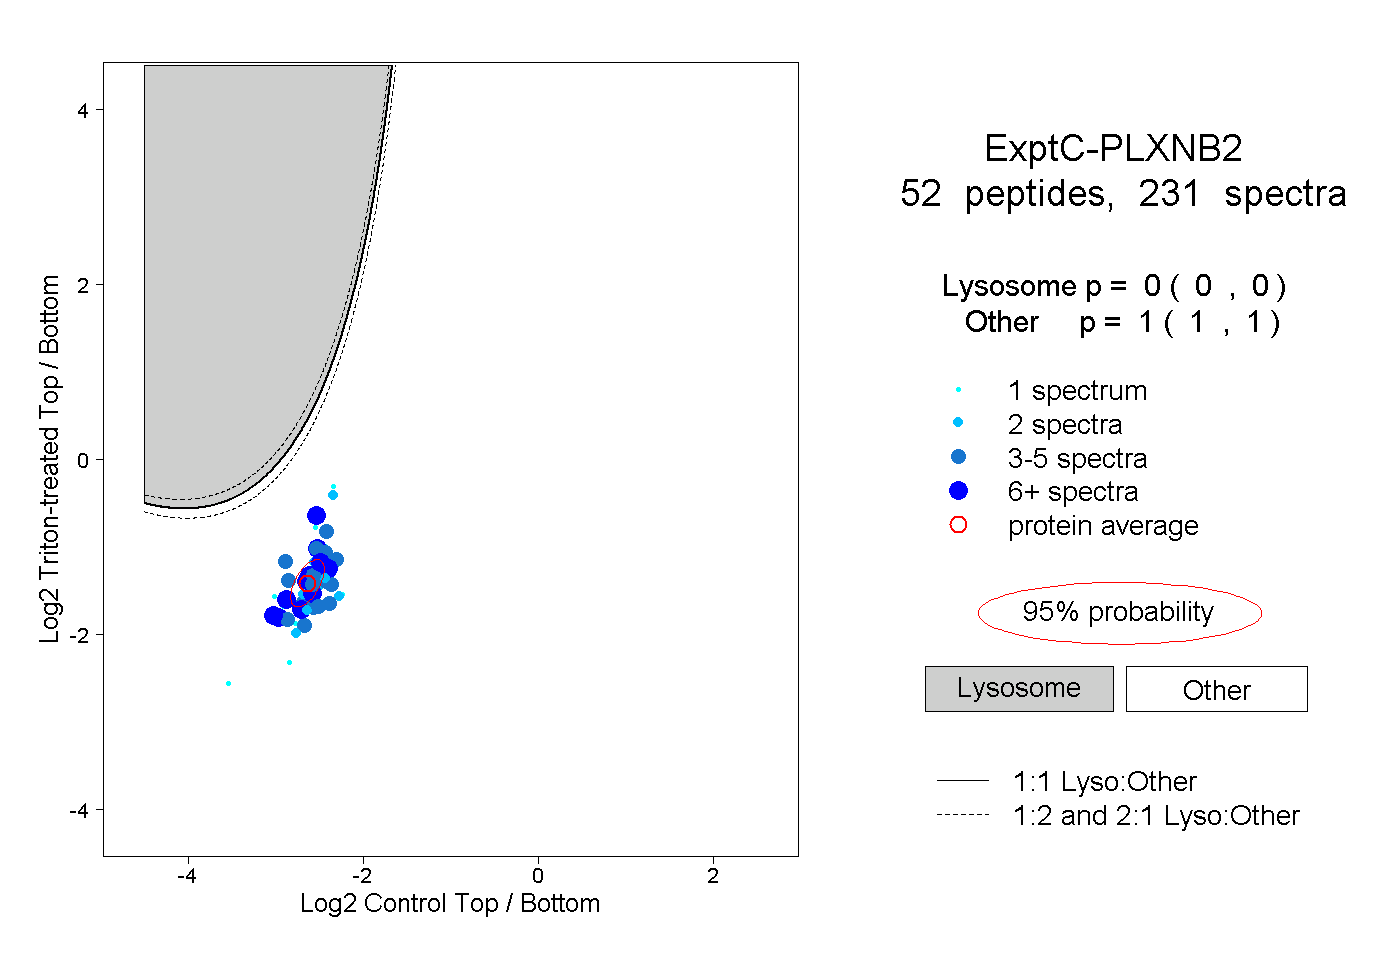
52
52peptides
spectra

0.000 | 0.000
0.121 | 0.127
0.000 | 0.000
0.111 | 0.117
0.000 | 0.000
0.757 | 0.765
0.000 | 0.000
0.000 | 0.000
22peptides
spectra
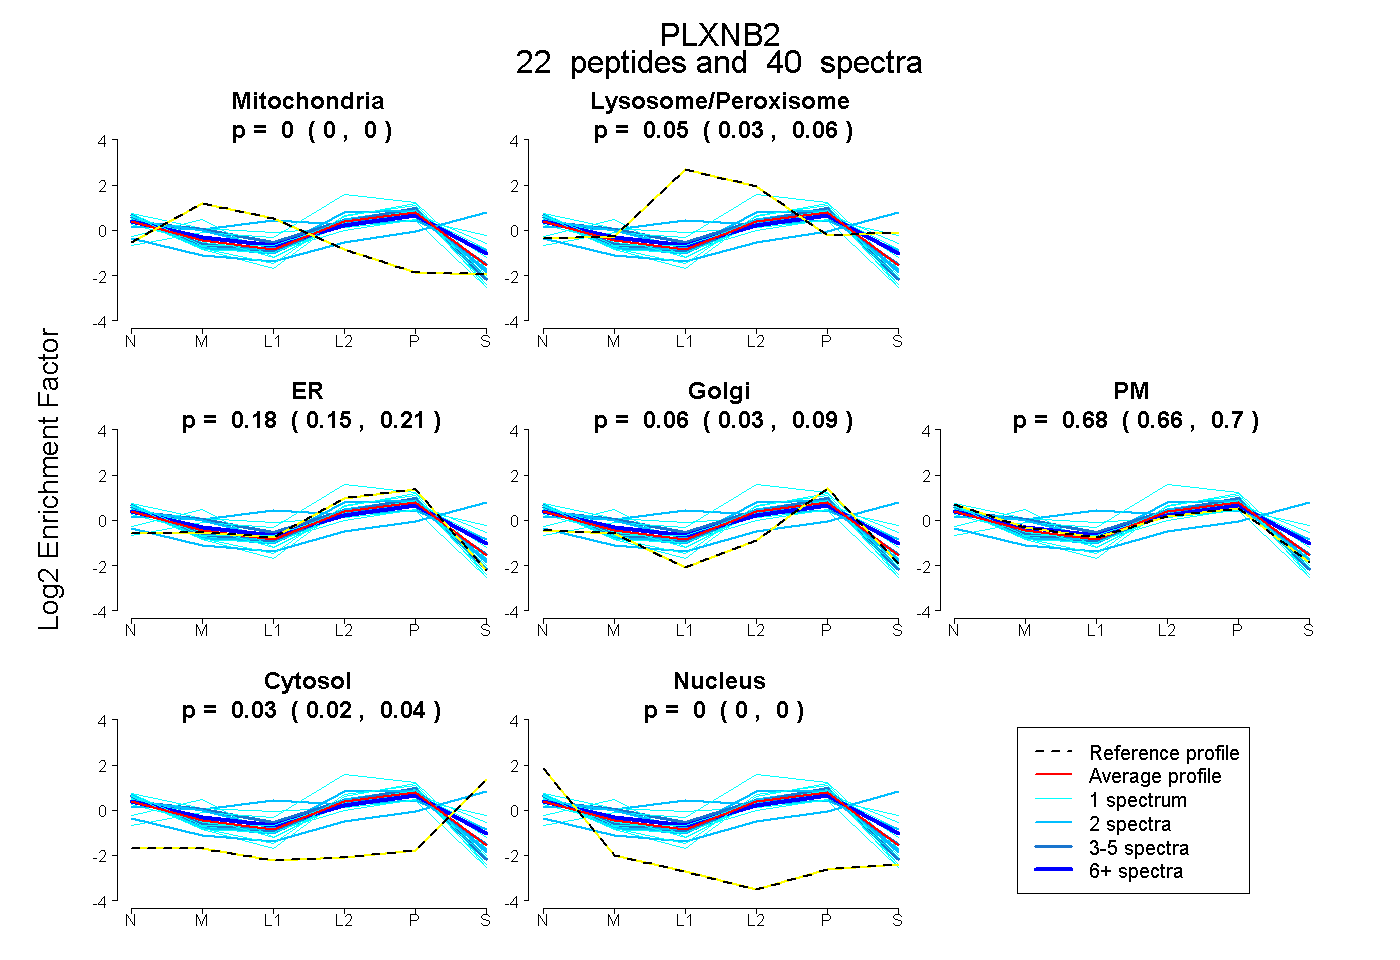
0.000 | 0.000
0.030 | 0.059
0.153 | 0.207
0.026 | 0.085
0.664 | 0.701
0.022 | 0.037
0.000 | 0.000