 2
2peptides
spectra
0.000 | 0.000
0.000 | 0.000
0.115 | 0.235
0.000 | 0.095
0.000 | 0.000
0.310 | 0.444
0.365 | 0.428
0.000 | 0.011
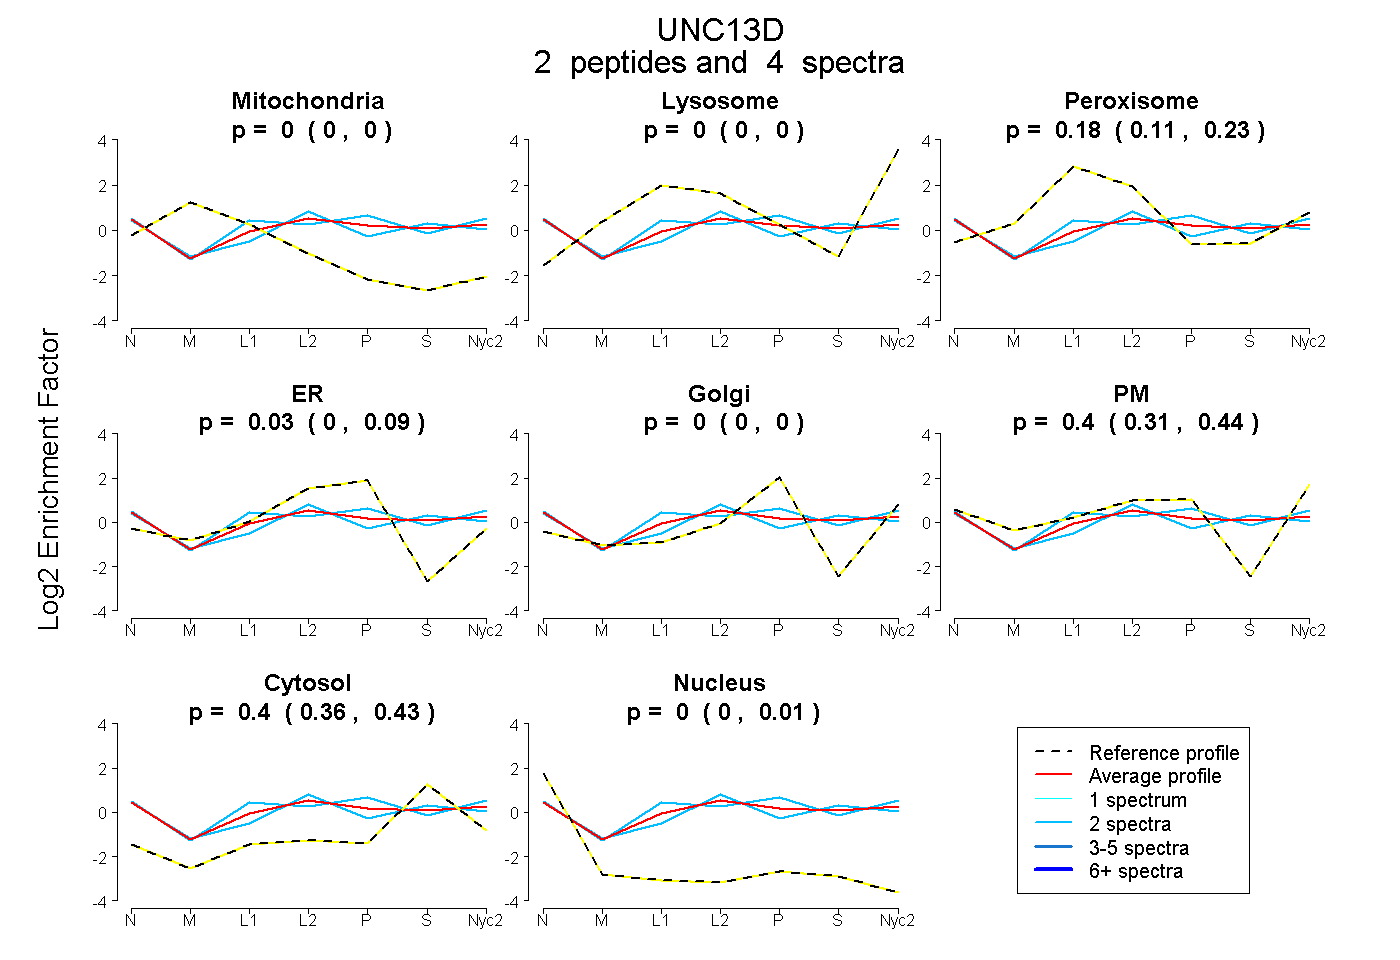
| Plot | Mito | Lyso | Perox | ER | Golgi | PM | Cytosol | Nucleus | |||||
| Expt A |
2 peptides |
4 spectra |
|
0.000 0.000 | 0.000 |
0.000 0.000 | 0.000 |
0.175 0.115 | 0.235 |
0.026 0.000 | 0.095 |
0.000 0.000 | 0.000 |
0.397 0.310 | 0.444 |
0.402 0.365 | 0.428 |
0.000 0.000 | 0.011 |