6
6peptides
spectra
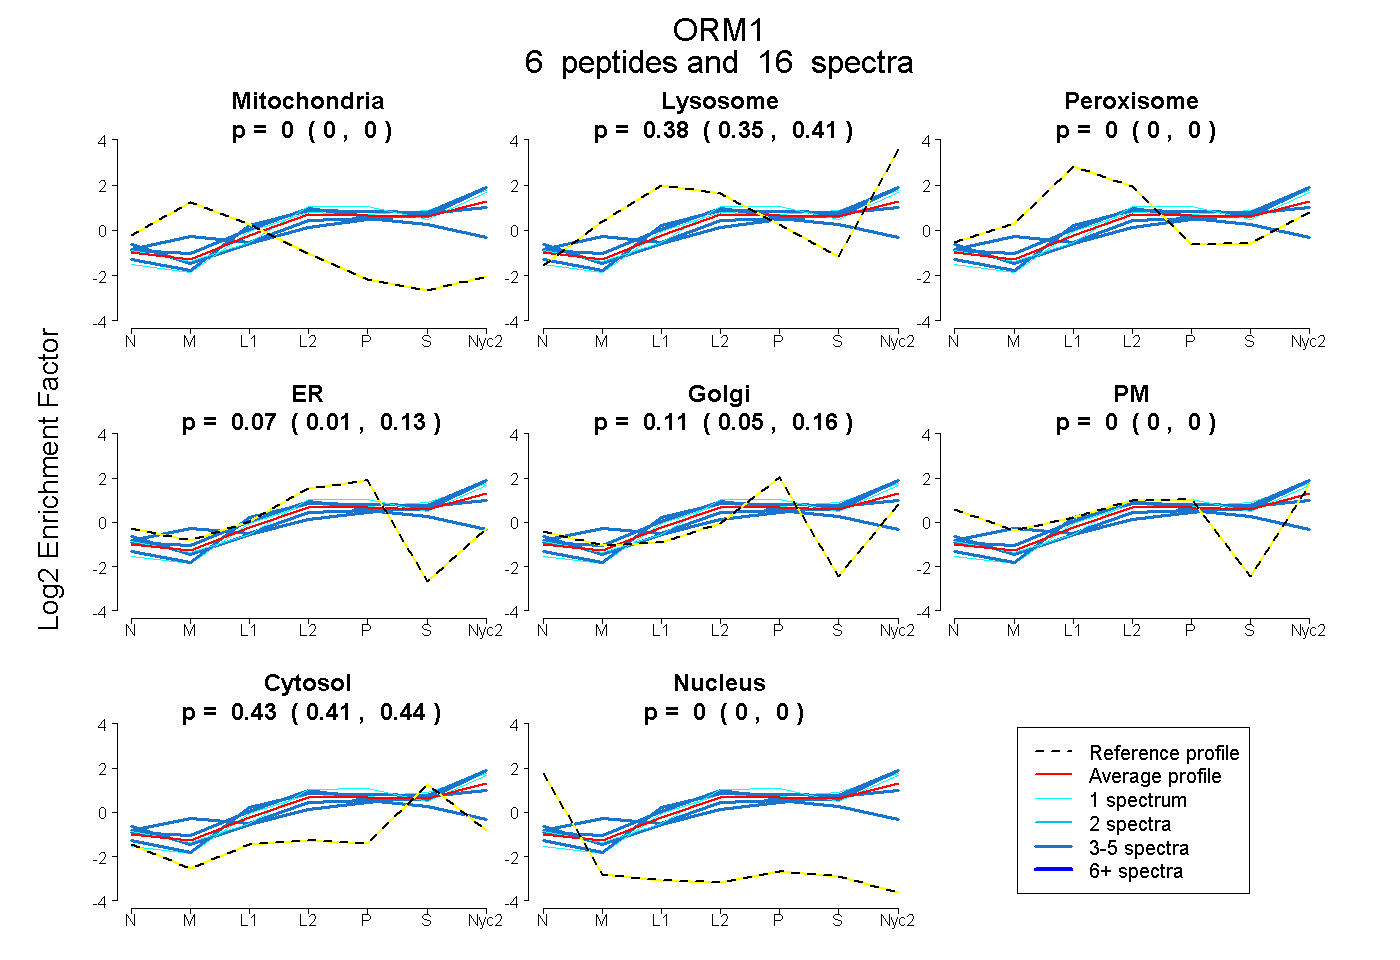
0.000 | 0.000
0.353 | 0.405
0.000 | 0.000
0.007 | 0.130
0.055 | 0.158
0.000 | 0.000
0.414 | 0.444
0.000 | 0.000
3peptides
spectra
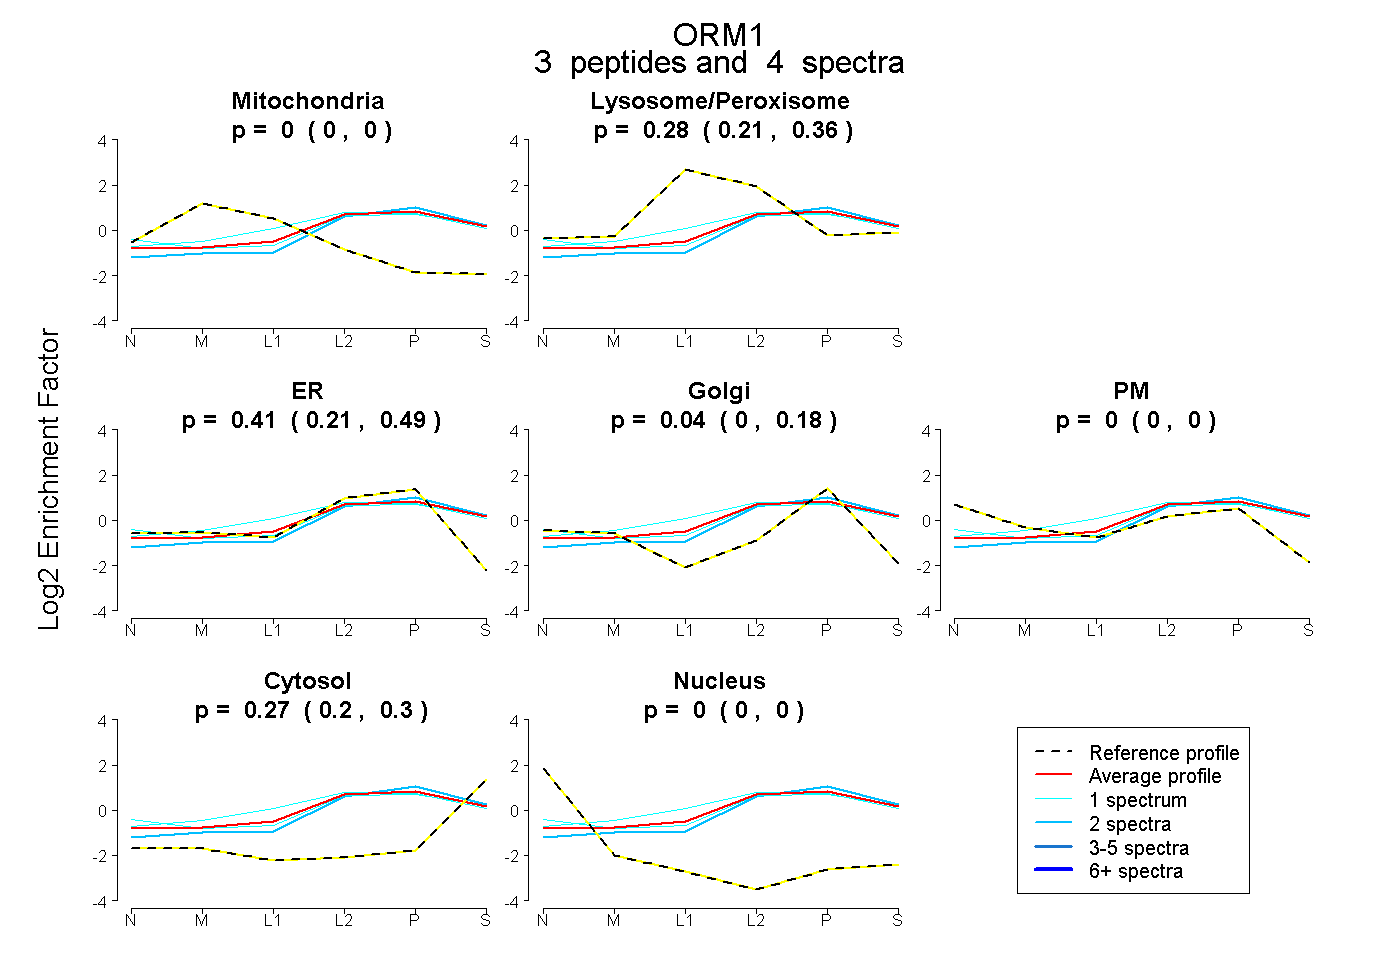
0.000 | 0.000
0.211 | 0.363
0.212 | 0.487
0.000 | 0.176
0.000 | 0.000
0.205 | 0.297
0.000 | 0.000
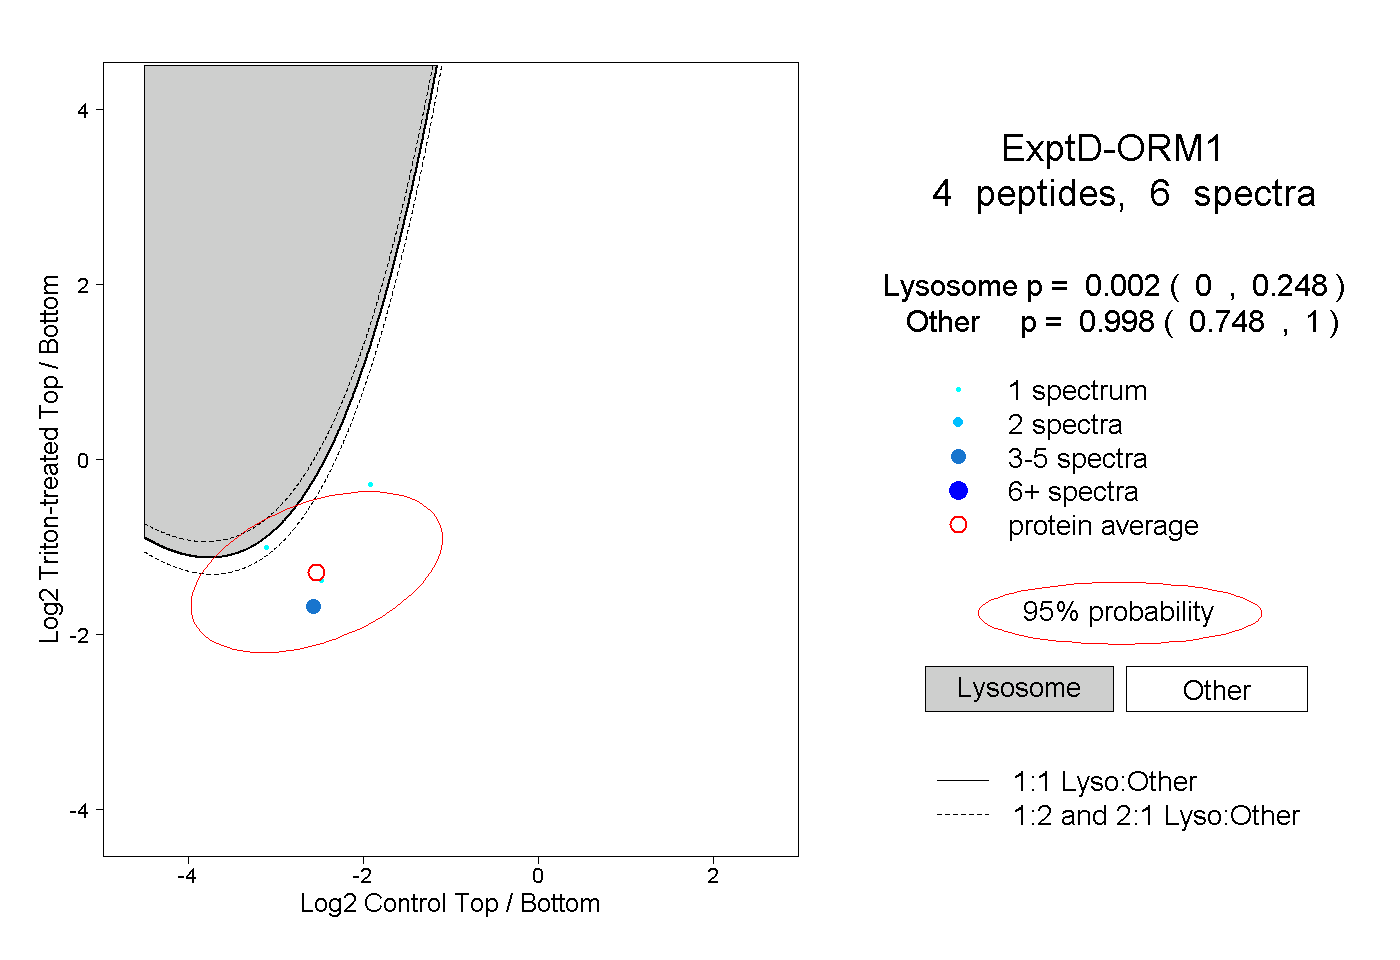
9peptides
spectra
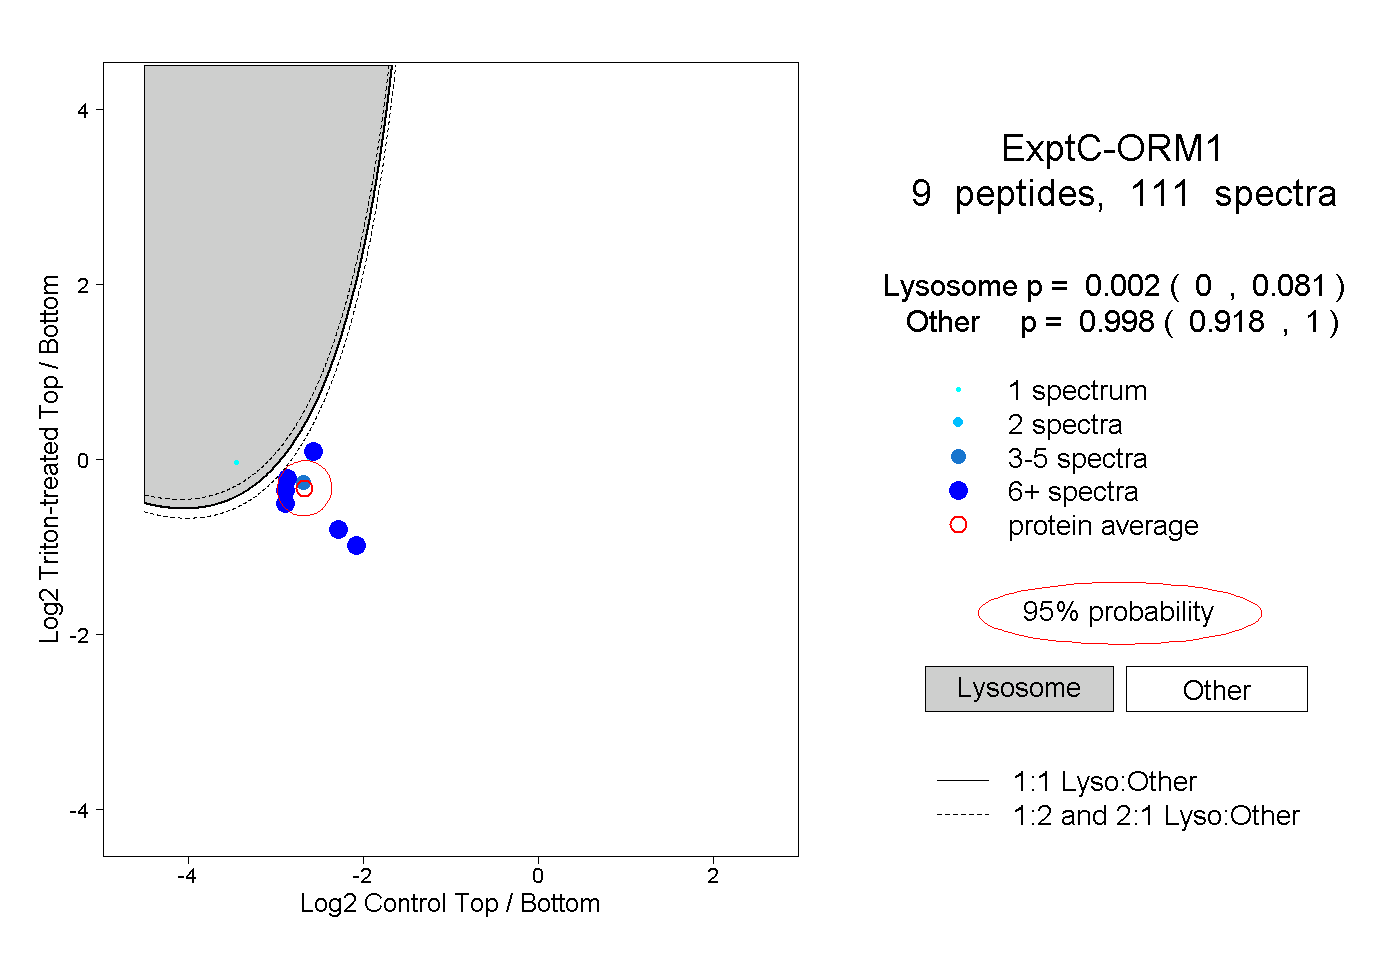
0.000 | 0.081
0.918 | 1.000