ORM1
[ENSRNOP00000010454]
Main page
| | | Plot |
Mito |
Lyso |
|
Perox |
ER |
Golgi |
PM |
Cytosol |
Nucleus |
|
| Expt A |
 6
6
peptides |
16
spectra |
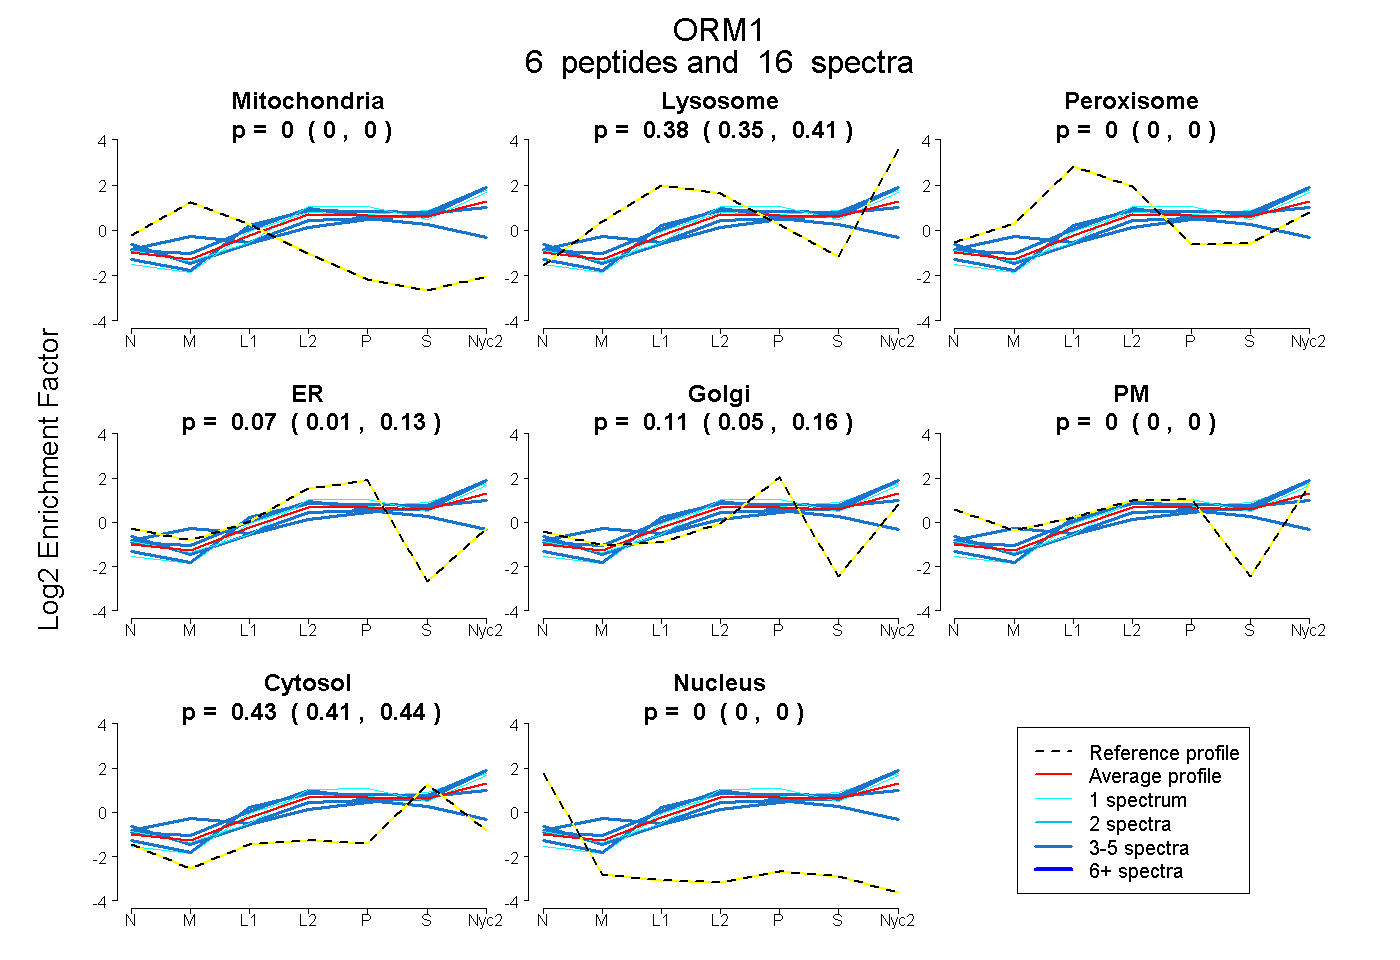 |
0.000
0.000 | 0.000 |
0.382
0.353 | 0.405 |
|
0.000
0.000 | 0.000 |
0.075
0.007 | 0.130 |
0.113
0.055 | 0.158 |
0.000
0.000 | 0.000 |
0.430
0.414 | 0.444 |
0.000
0.000 | 0.000 |
|
| | | Plot |
Mito |
|
Lyso or Perox |
|
ER |
Golgi |
PM |
Cytosol |
Nucleus |
|
| Expt B |
3
peptides |
4
spectra |
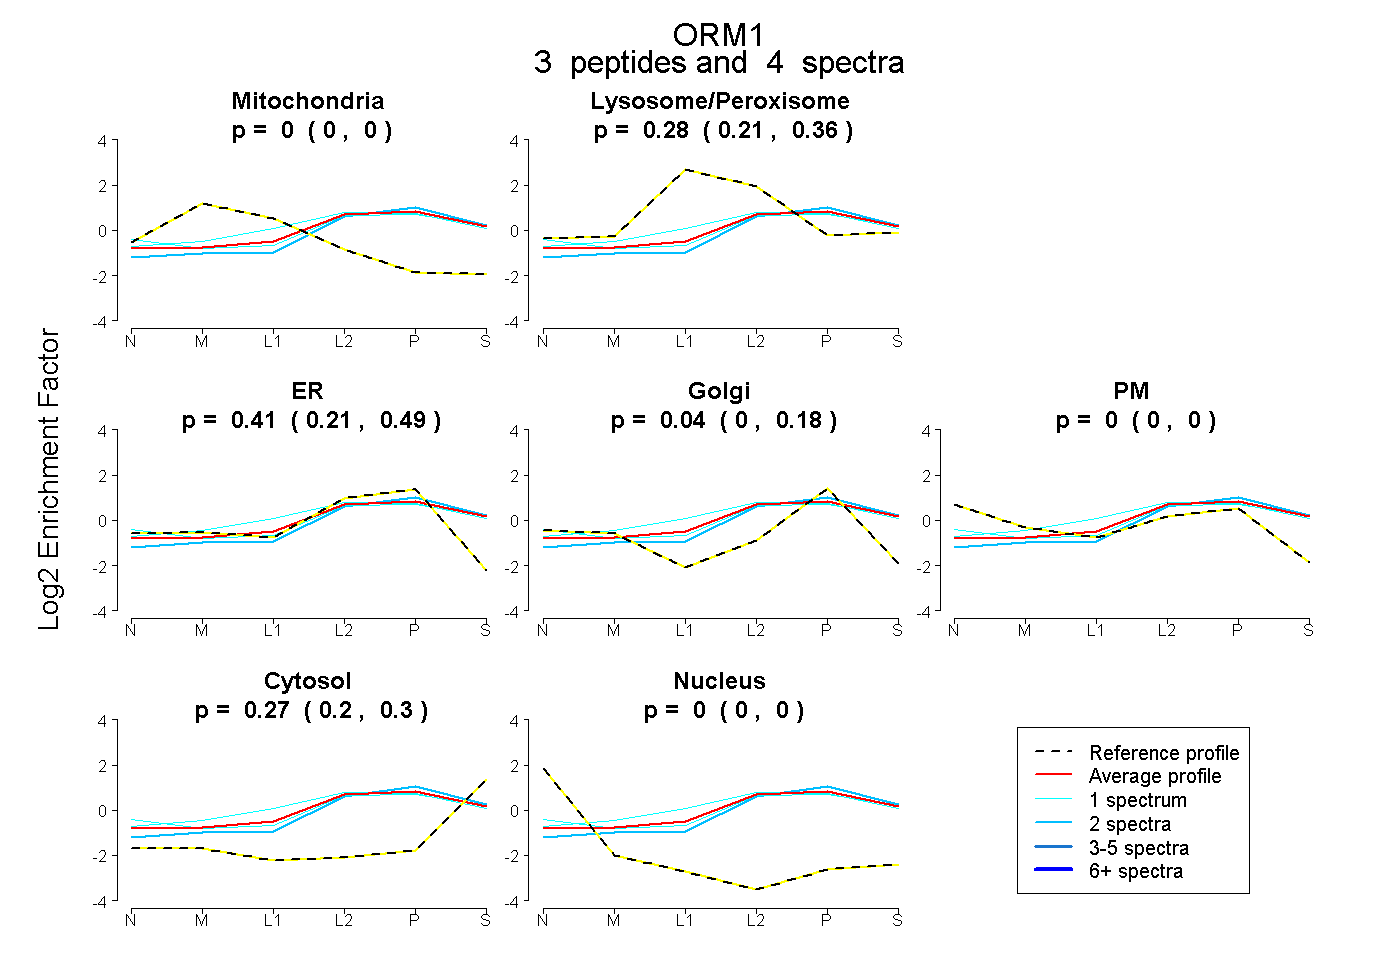 |
0.000
0.000 | 0.000 |
|
0.277
0.211 | 0.363 |
|
0.413
0.212 | 0.487 |
0.042
0.000 | 0.176 |
0.000
0.000 | 0.000 |
0.268
0.205 | 0.297 |
0.000
0.000 | 0.000 |
|
| 2 spectra, GLSFYAK |
0.000 |
|
0.156 |
|
0.522 |
0.000 |
0.000 |
0.322 |
0.000 |
|
| 1 spectrum, KPDLSPELR |
0.000 |
|
0.306 |
|
0.284 |
0.162 |
0.000 |
0.248 |
0.000 |
|
| 1 spectrum, IFQQAVK |
0.000 |
|
0.454 |
|
0.175 |
0.204 |
0.000 |
0.167 |
0.000 |
|
| | | Plot |
|
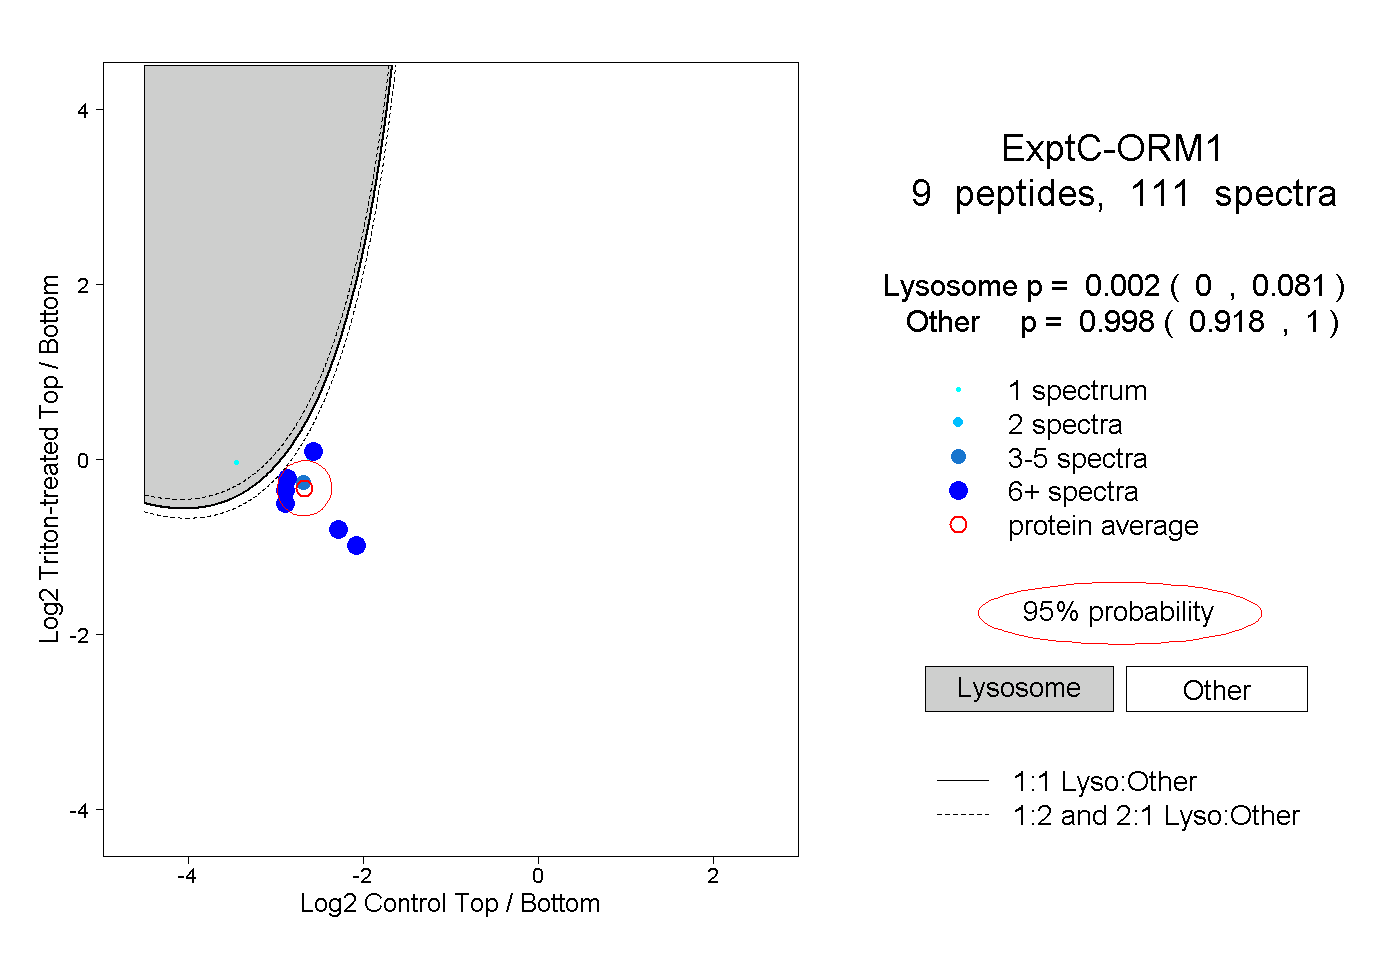
Lyso |
|
|
|
|
|
|
|
Other |
| Expt C |
9
peptides |
111
spectra |
 |
|
0.002
0.000 | 0.081 |
|
|
|
|
|
|
|
0.998
0.918 | 1.000 |
| | | Plot |
|
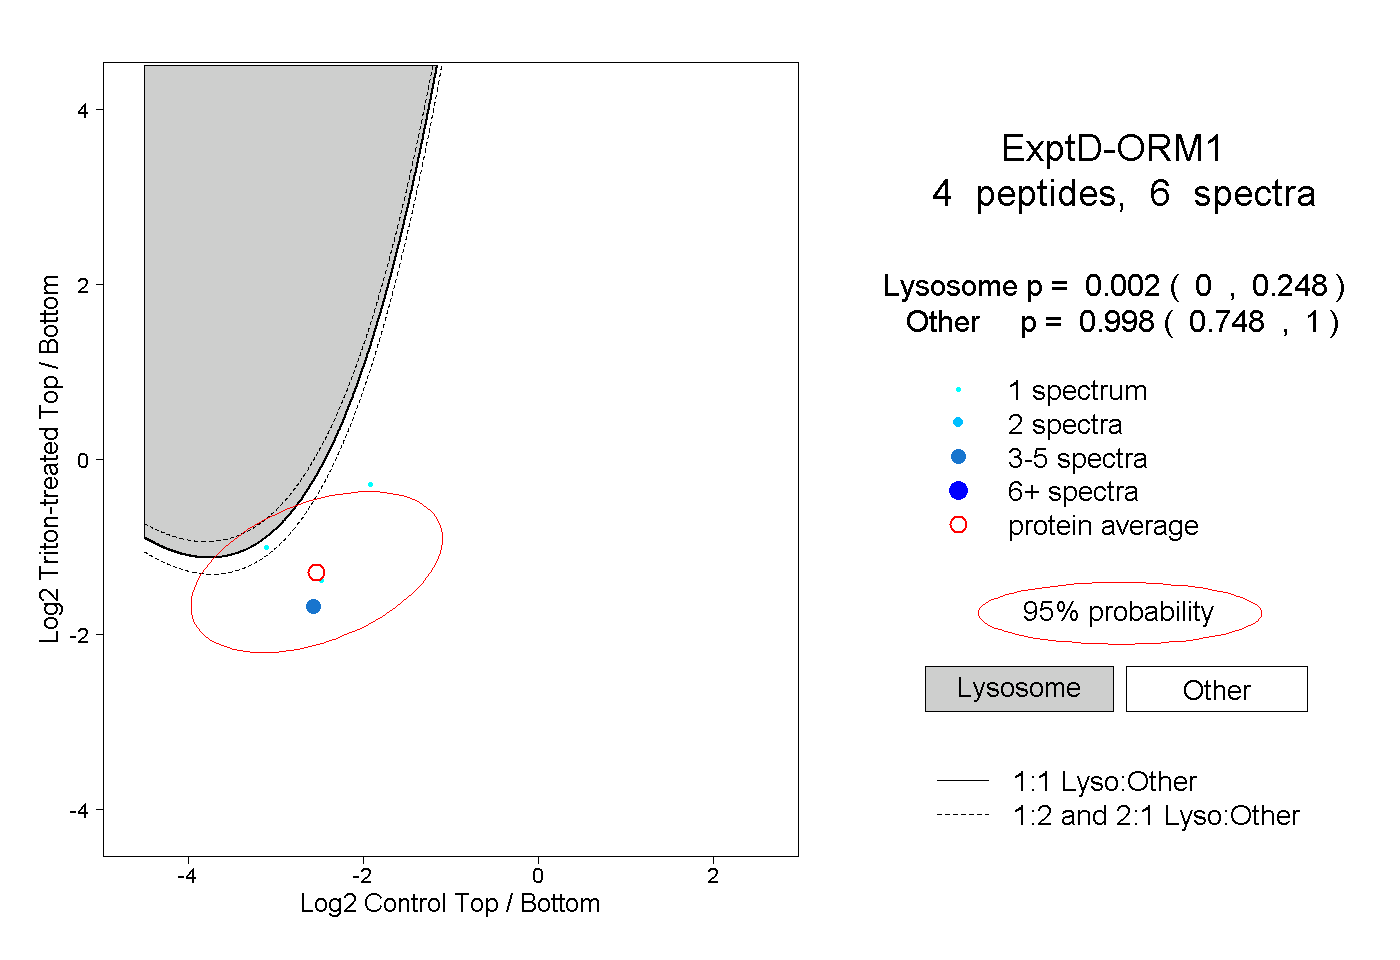
Lyso |
|
|
|
|
|
|
|
Other |
| Expt D |
4
peptides |
6
spectra |
 |
|
0.002
0.000 | 0.248 |
|
|
|
|
|
|
|
0.998
0.748 | 1.000 |