 9
9peptides
spectra

0.000 | 0.000
0.000 | 0.005
0.000 | 0.026
0.000 | 0.000
0.036 | 0.082
0.115 | 0.178
0.768 | 0.780
0.000 | 0.000
3peptides
spectra
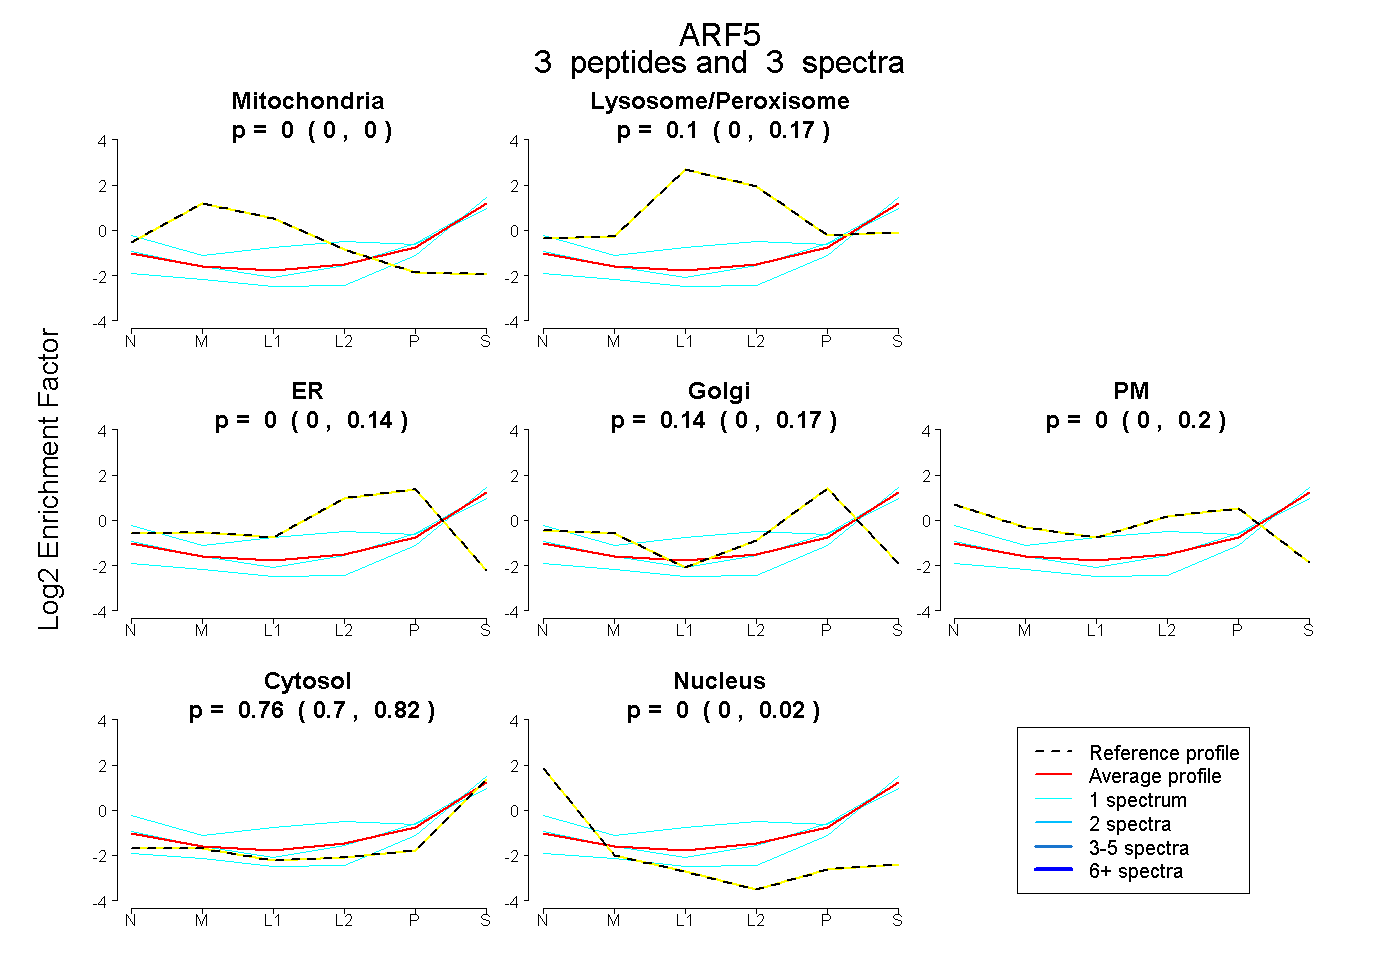
0.000 | 0.000
0.000 | 0.166
0.000 | 0.140
0.000 | 0.175
0.000 | 0.198
0.696 | 0.822
0.000 | 0.021
5peptides
spectra
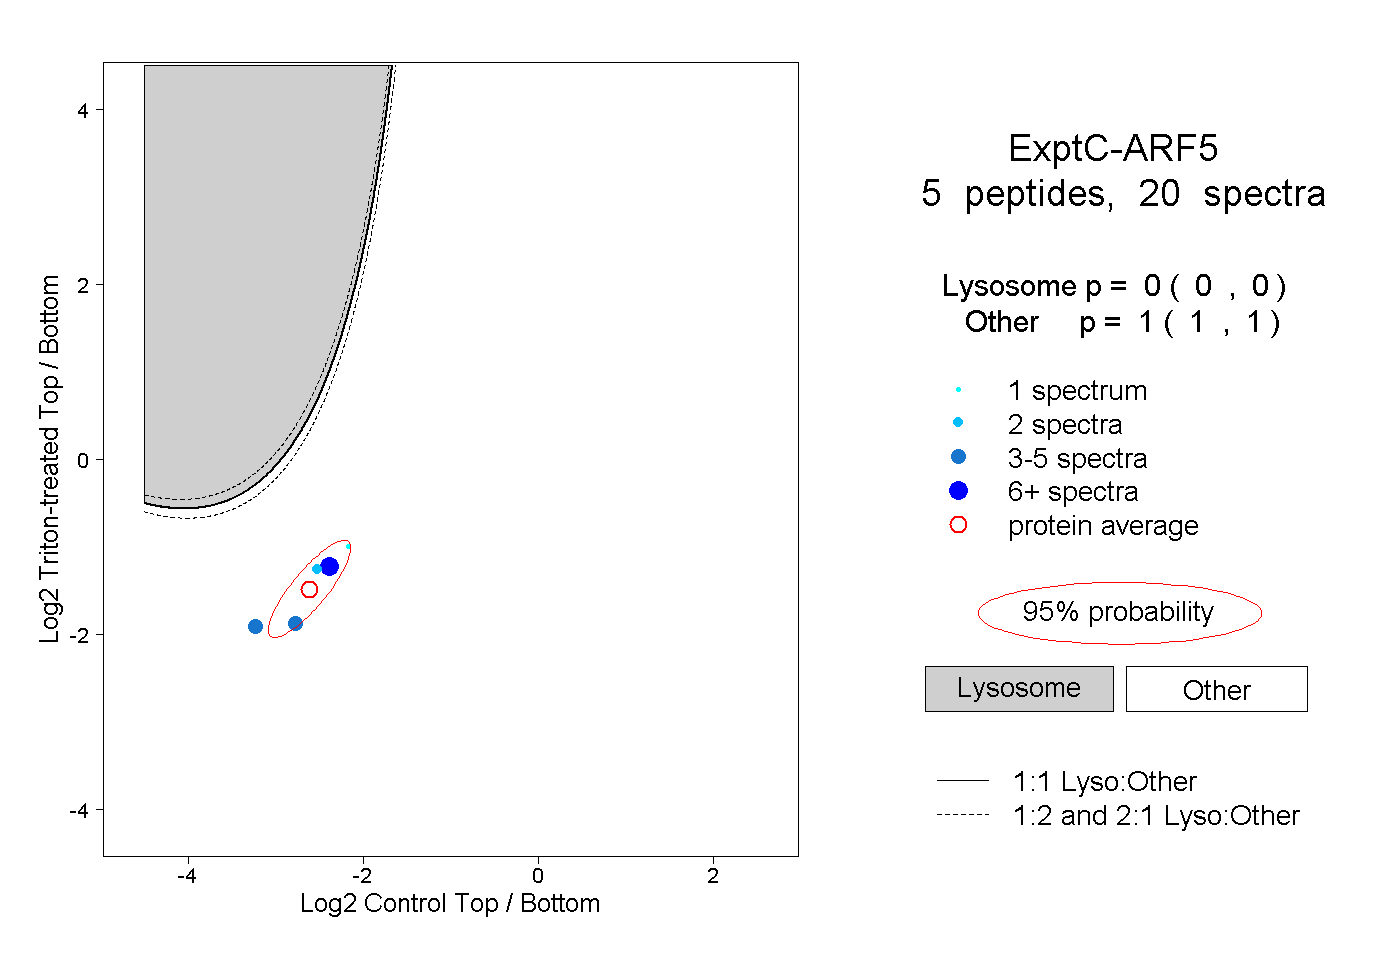
0.000 | 0.000
1.000 | 1.000
2peptides
spectra
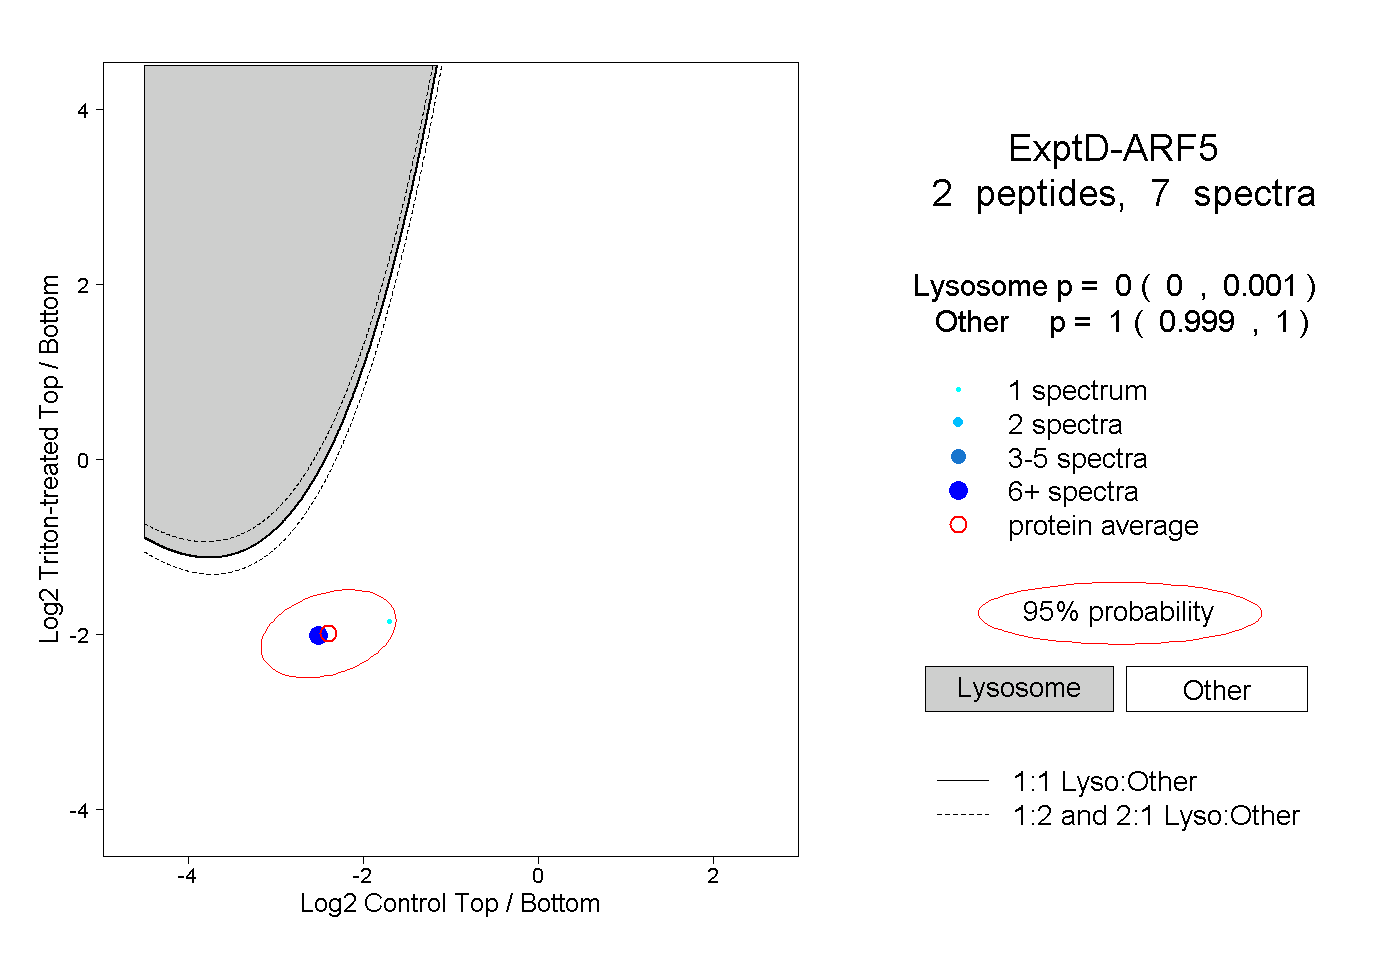
0.000 | 0.001
0.999 | 1.000