13
13peptides
spectra
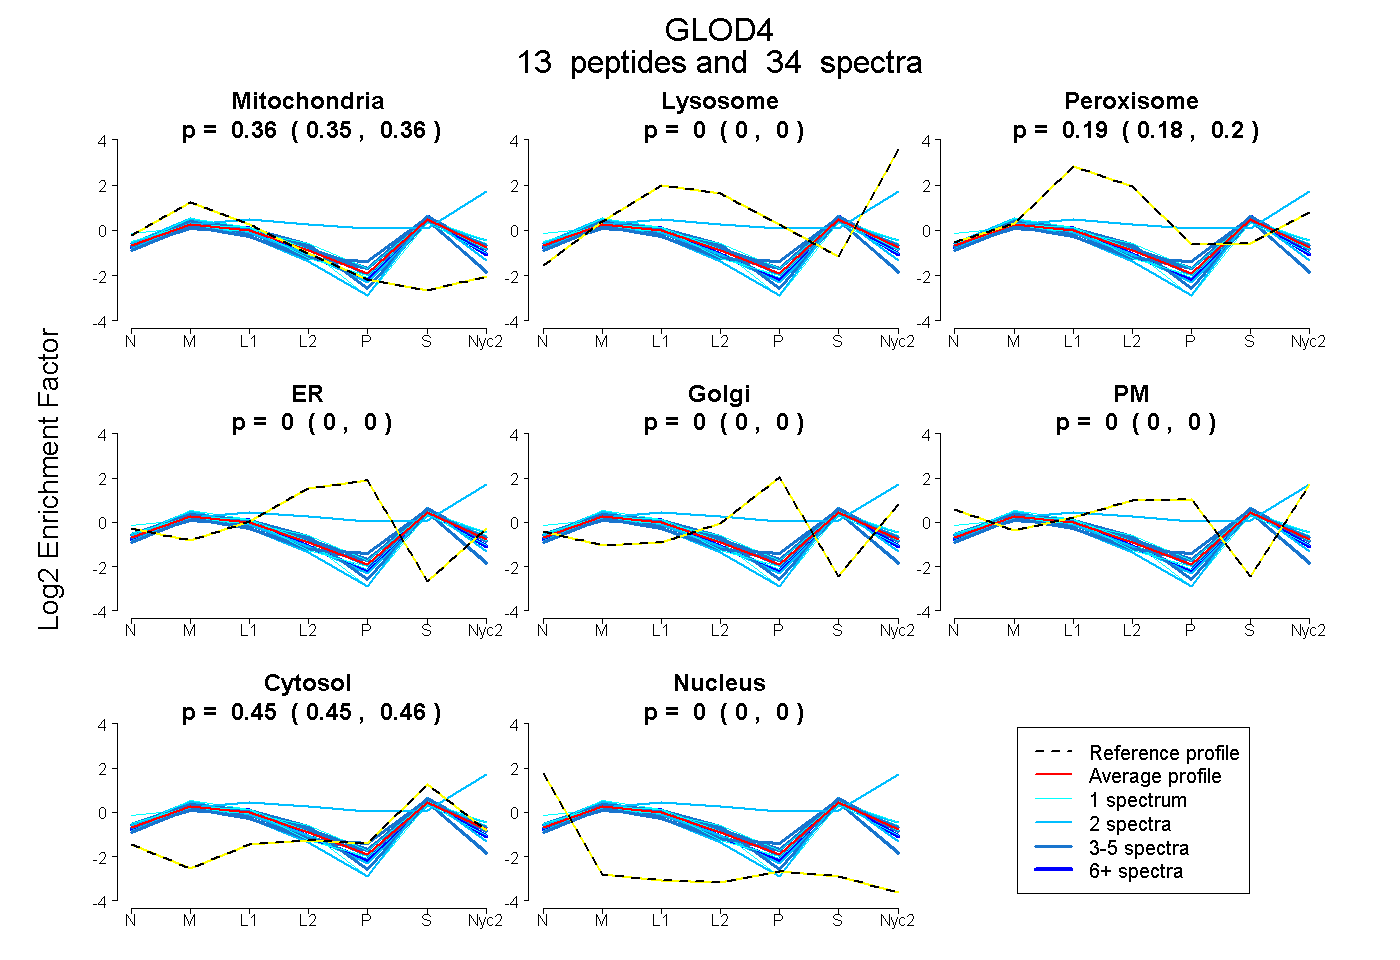
0.346 | 0.363
0.000 | 0.000
0.182 | 0.198
0.000 | 0.000
0.000 | 0.000
0.000 | 0.000
0.451 | 0.457
0.000 | 0.000
6peptides
spectra
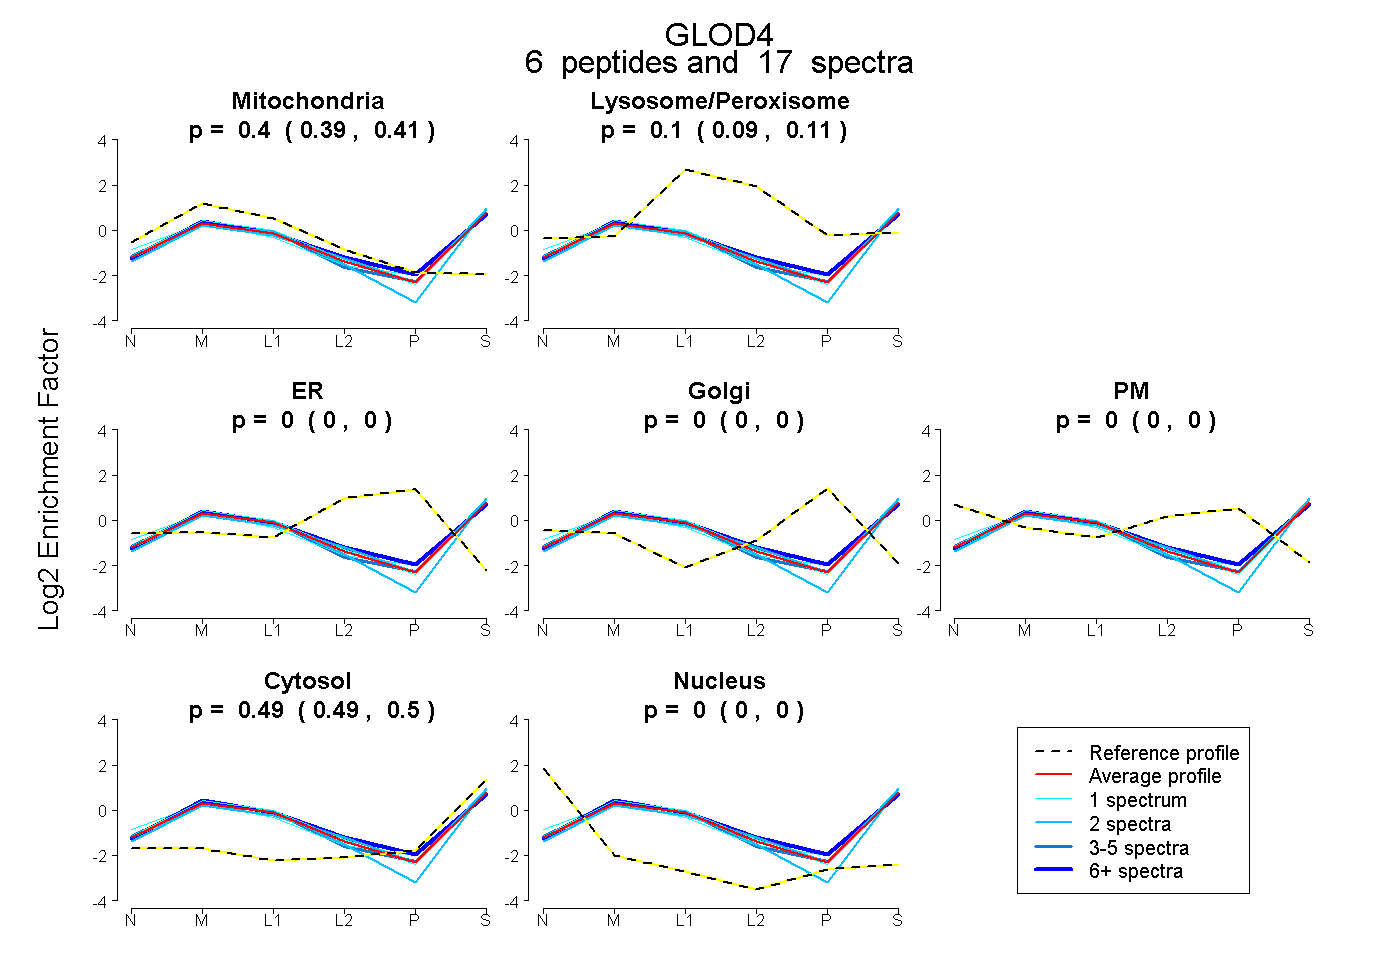
0.392 | 0.411
0.093 | 0.112
0.000 | 0.000
0.000 | 0.000
0.000 | 0.000
0.490 | 0.498
0.000 | 0.000