 13
13peptides
spectra
0.346 | 0.363
0.000 | 0.000
0.182 | 0.198
0.000 | 0.000
0.000 | 0.000
0.000 | 0.000
0.451 | 0.457
0.000 | 0.000
| Plot | Mito | Lyso | Perox | ER | Golgi | PM | Cytosol | Nucleus | |||||
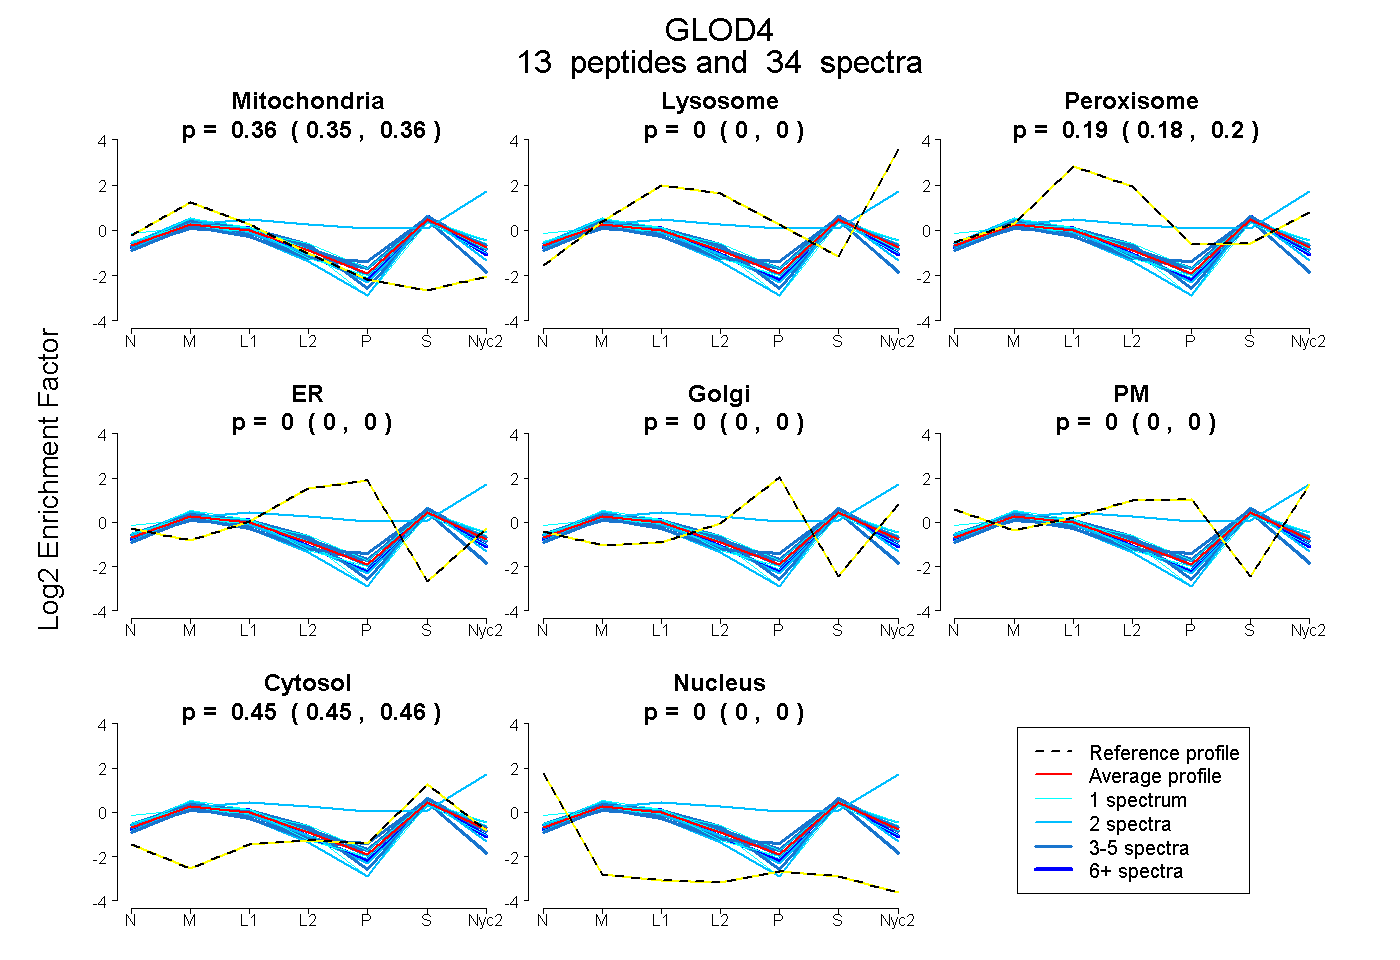
| Expt A |
13 peptides |
34 spectra |
|
0.355 0.346 | 0.363 |
0.000 0.000 | 0.000 |
0.191 0.182 | 0.198 |
0.000 0.000 | 0.000 |
0.000 0.000 | 0.000 |
0.000 0.000 | 0.000 |
0.454 0.451 | 0.457 |
0.000 0.000 | 0.000 |
| 2 spectra, LELQGIQGAVDHSAAFGR | 0.477 | 0.000 | 0.015 | 0.000 | 0.000 | 0.000 | 0.508 | 0.000 | ||
| 1 spectrum, LLDDAMAADK | 0.288 | 0.008 | 0.253 | 0.000 | 0.000 | 0.000 | 0.450 | 0.000 | ||
| 1 spectrum, SPSQSDPVLK | 0.389 | 0.000 | 0.158 | 0.000 | 0.000 | 0.000 | 0.453 | 0.000 | ||
| 2 spectra, SLNYWSNLLGMK | 0.036 | 0.453 | 0.054 | 0.000 | 0.000 | 0.155 | 0.302 | 0.000 | ||
| 2 spectra, FYLQDR | 0.415 | 0.058 | 0.107 | 0.000 | 0.000 | 0.000 | 0.420 | 0.000 | ||
| 1 spectrum, ELPDLEDLMK | 0.373 | 0.000 | 0.170 | 0.000 | 0.000 | 0.000 | 0.457 | 0.000 | ||
| 3 spectra, DVLGMQVLR | 0.331 | 0.000 | 0.164 | 0.000 | 0.000 | 0.000 | 0.505 | 0.000 | ||
| 3 spectra, HEEFEEGCK | 0.484 | 0.000 | 0.105 | 0.000 | 0.000 | 0.000 | 0.411 | 0.000 | ||
| 5 spectra, SDEWFATR | 0.343 | 0.035 | 0.103 | 0.000 | 0.000 | 0.000 | 0.519 | 0.000 | ||
| 6 spectra, ALHFVFK | 0.382 | 0.000 | 0.143 | 0.000 | 0.000 | 0.000 | 0.475 | 0.000 | ||
| 1 spectrum, IAFSCPQK | 0.467 | 0.000 | 0.139 | 0.000 | 0.000 | 0.000 | 0.394 | 0.000 | ||
| 3 spectra, AACNGPYDGK | 0.431 | 0.000 | 0.105 | 0.000 | 0.000 | 0.000 | 0.464 | 0.000 | ||
| 4 spectra, FQTVHFFR | 0.362 | 0.000 | 0.217 | 0.000 | 0.000 | 0.000 | 0.421 | 0.000 |
| Plot | Mito | Lyso or Perox | ER | Golgi | PM | Cytosol | Nucleus | ||||||
| Expt B |
6 peptides |
17 spectra |
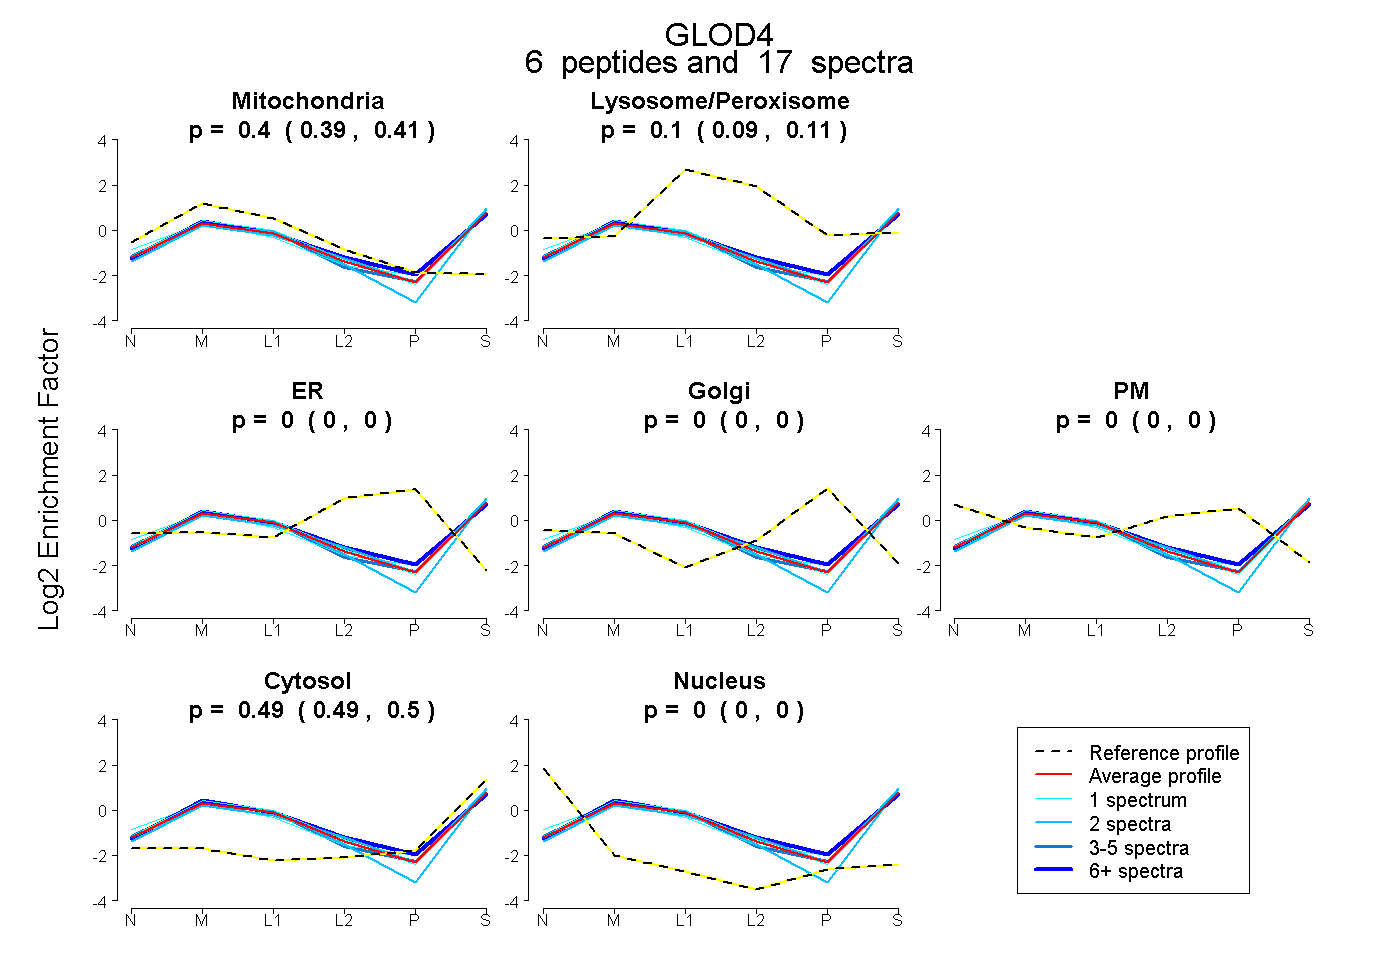 |
0.402 0.392 | 0.411 |
0.103 0.093 | 0.112 |
0.000 0.000 | 0.000 |
0.000 0.000 | 0.000 |
0.000 0.000 | 0.000 |
0.494 0.490 | 0.498 |
0.000 0.000 | 0.000 |
|||
| Plot | Lyso | Other | |||||||||||
| Expt C |
17 peptides |
69 spectra |
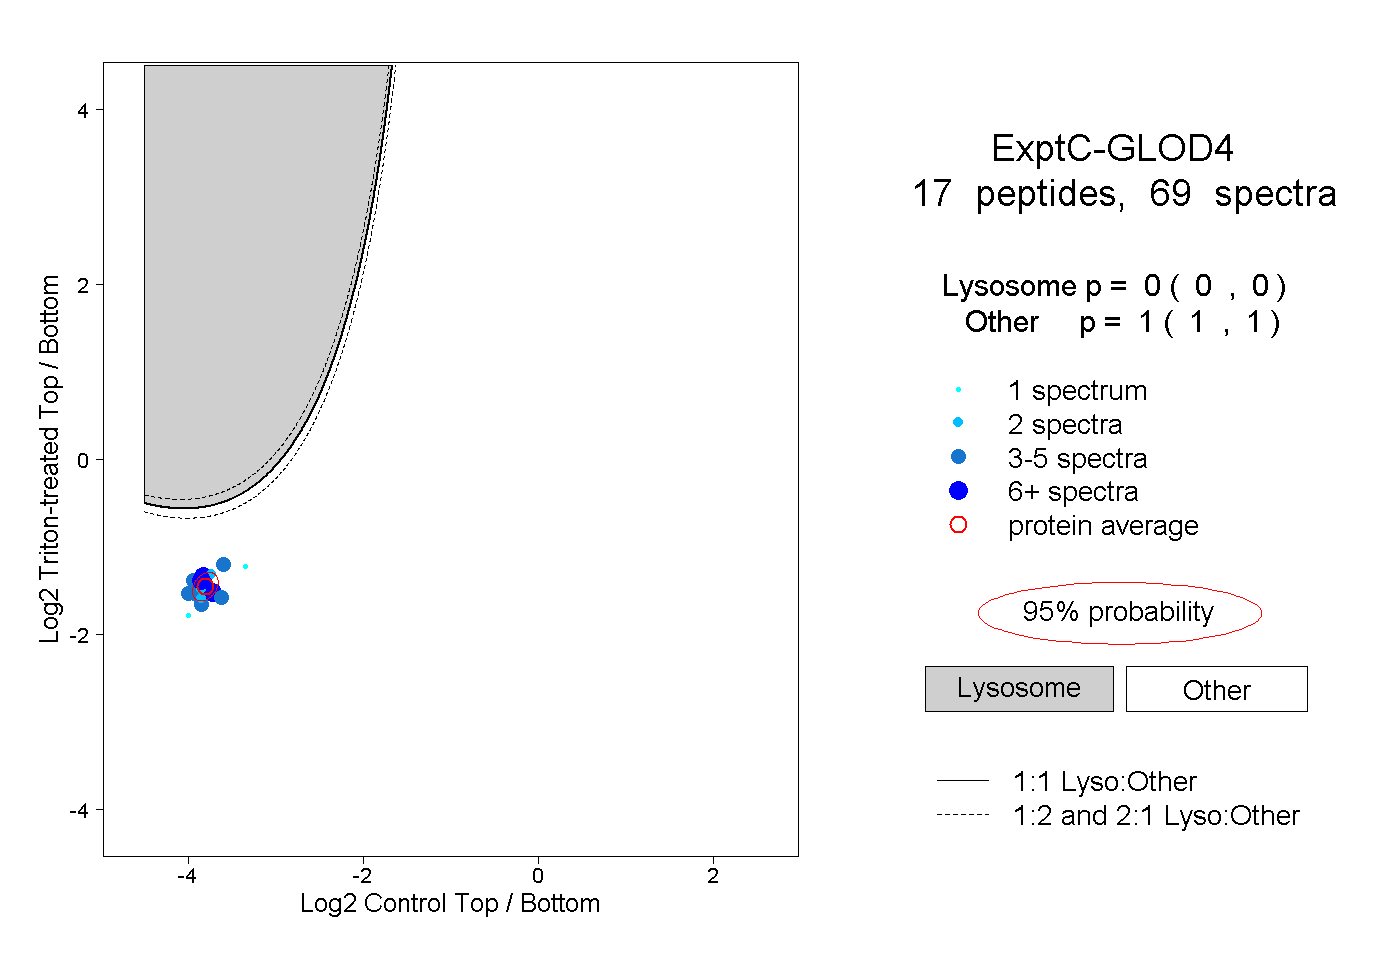 |
0.000 0.000 | 0.000 |
1.000 1.000 | 1.000 |
||||||||
| Plot | Lyso | Other | |||||||||||
| Expt D |
4 peptides |
10 spectra |
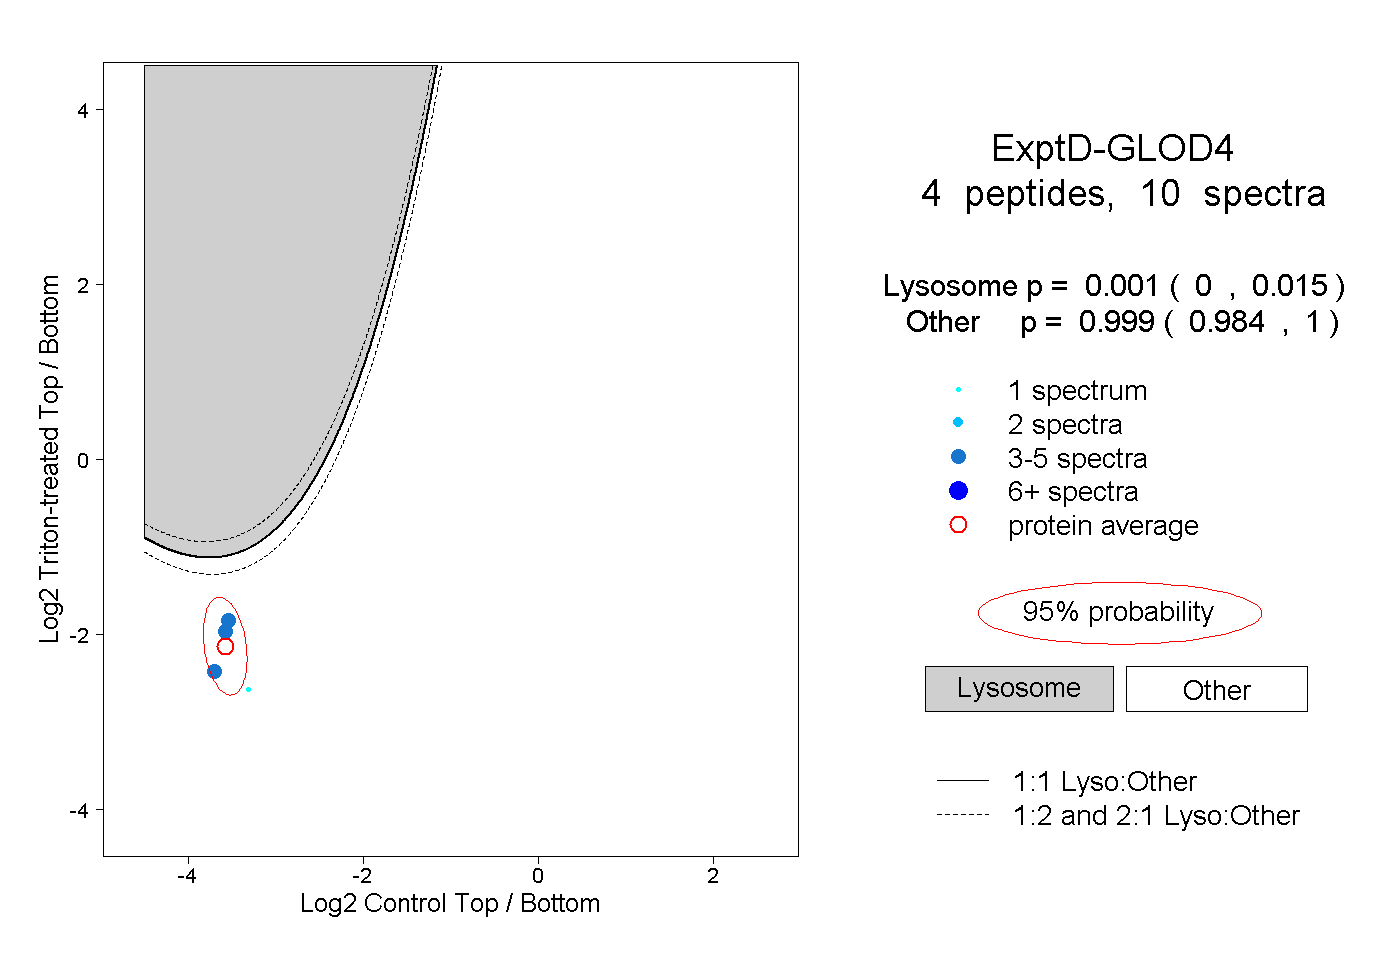 |
0.001 0.000 | 0.015 |
0.999 0.984 | 1.000 |