14
14peptides
spectra
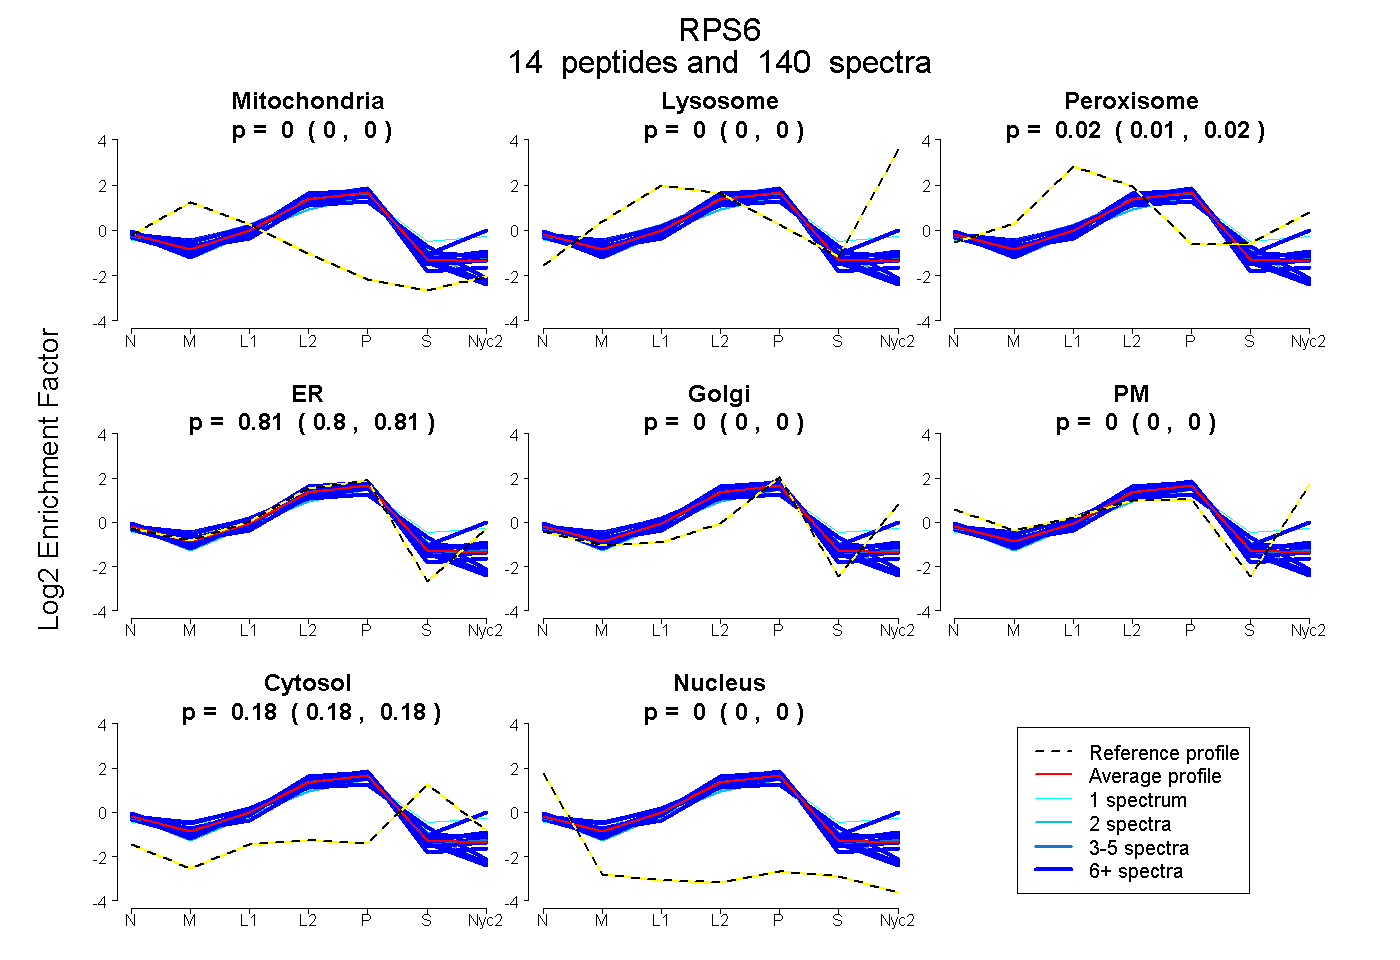
0.000 | 0.002
0.000 | 0.000
0.012 | 0.018
0.804 | 0.809
0.000 | 0.000
0.000 | 0.000
0.176 | 0.179
0.000 | 0.000
9peptides
spectra
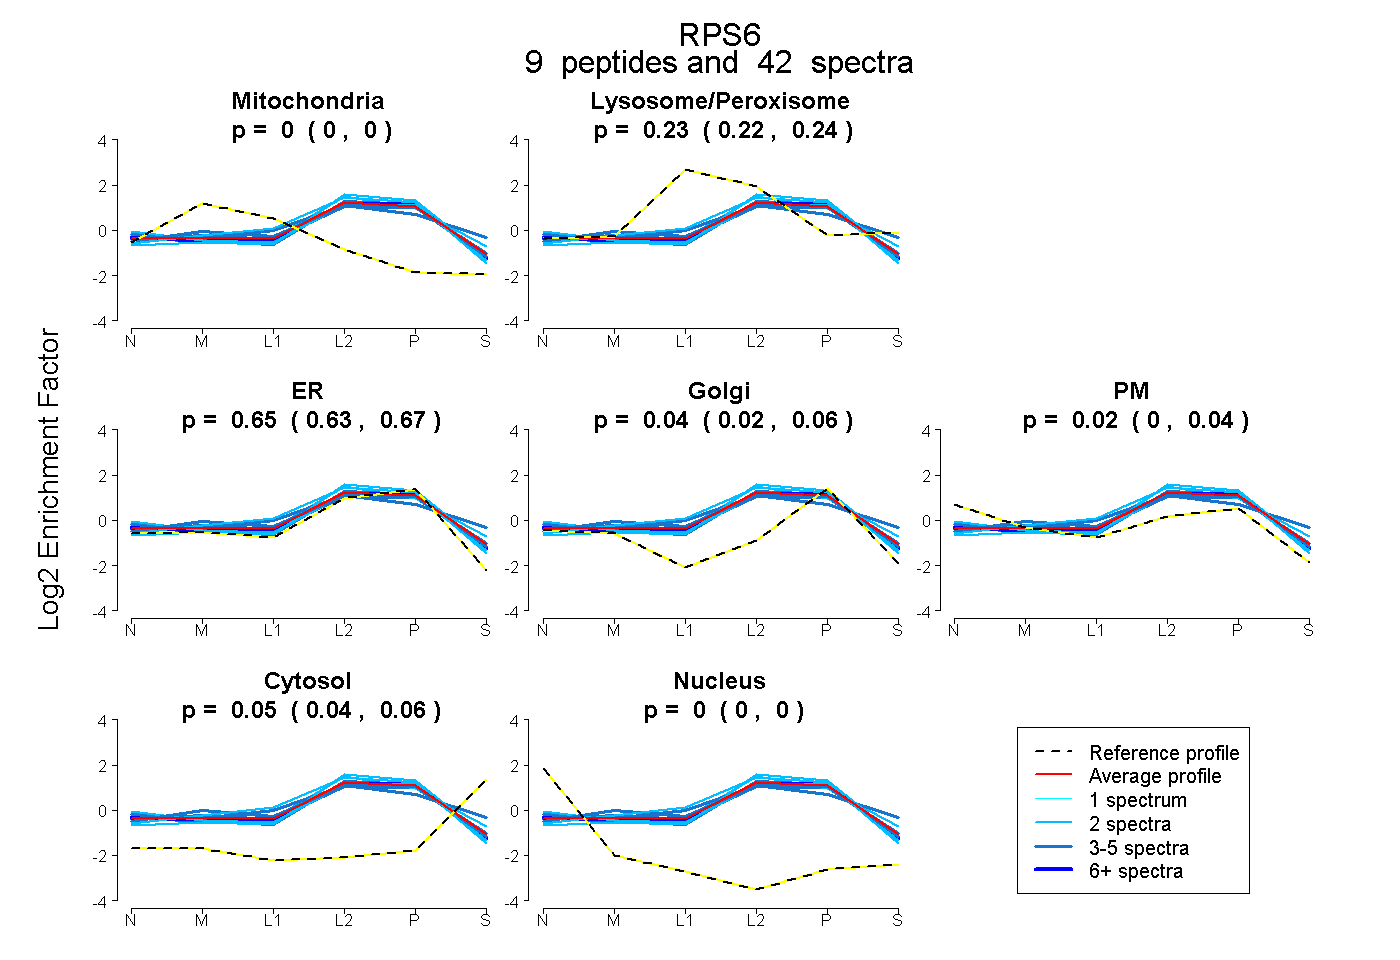
0.000 | 0.000
0.221 | 0.242
0.632 | 0.674
0.017 | 0.063
0.005 | 0.036
0.043 | 0.055
0.000 | 0.000
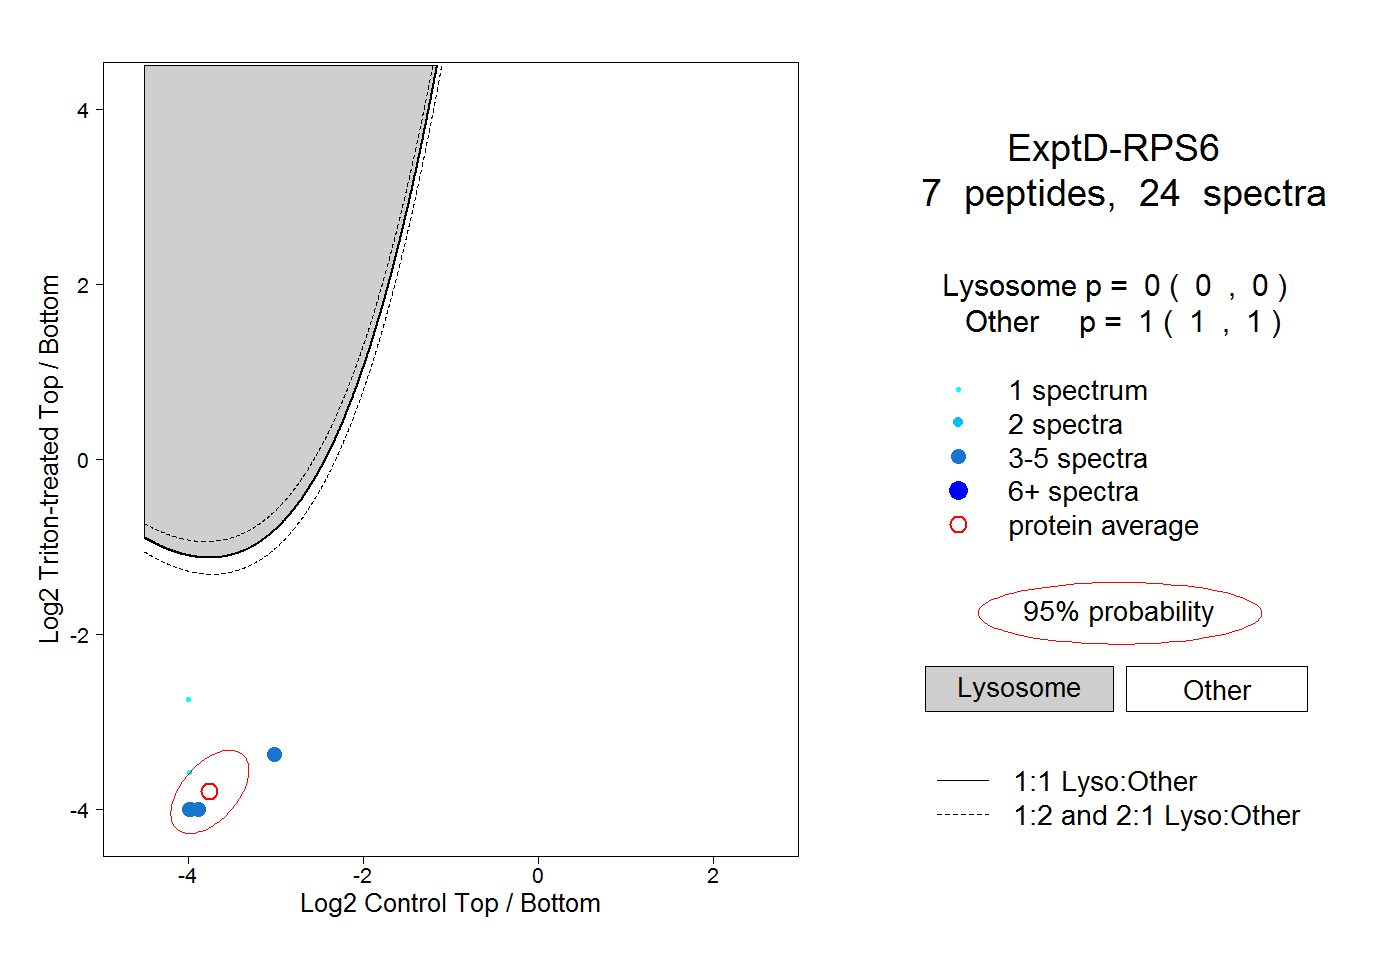
12peptides
spectra
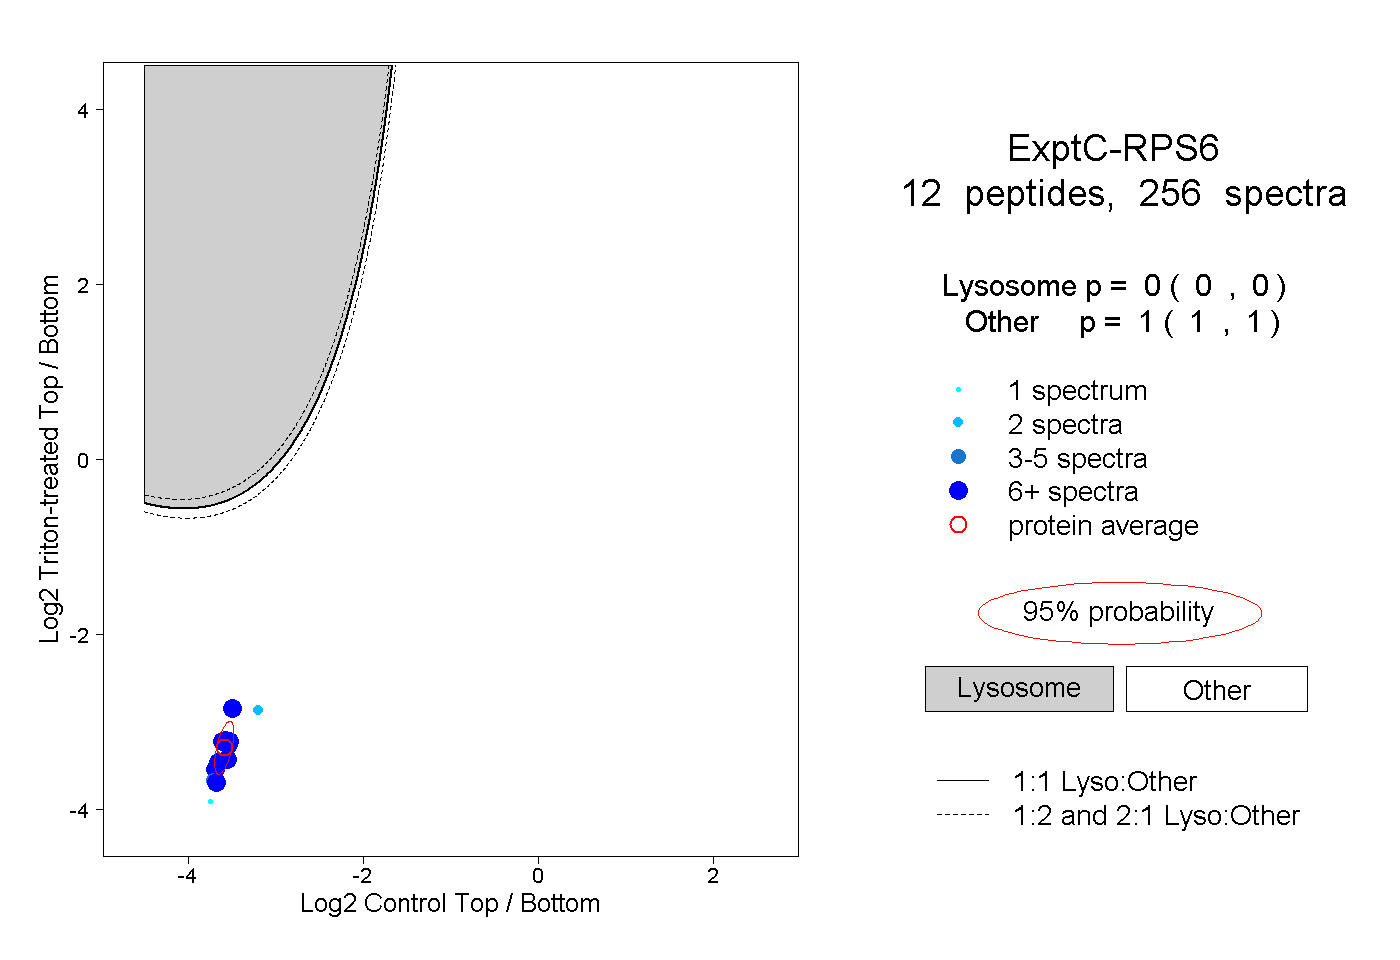
0.000 | 0.000
1.000 | 1.000