 4
4peptides
spectra
0.000 | 0.000
0.000 | 0.000
0.000 | 0.000
0.356 | 0.577
0.000 | 0.082
0.038 | 0.226
0.260 | 0.335
0.023 | 0.079
1peptide
spectrum
NA | NA
NA | NA
NA | NA
NA | NA
NA | NA
NA | NA
NA | NA
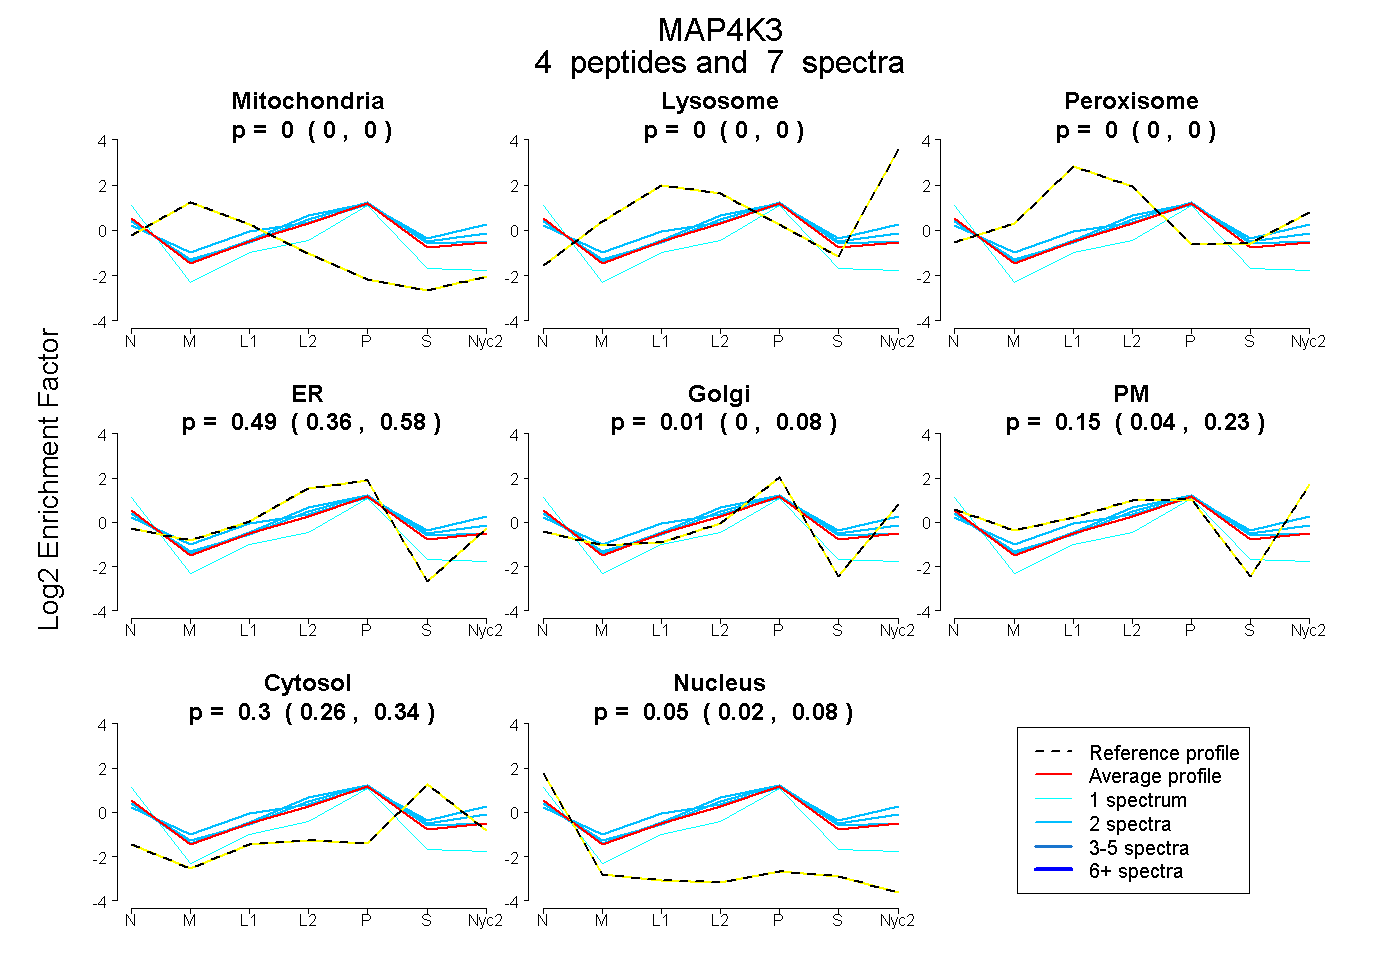
| Plot | Mito | Lyso | Perox | ER | Golgi | PM | Cytosol | Nucleus | |||||
| Expt A |
4 peptides |
7 spectra |
|
0.000 0.000 | 0.000 |
0.000 0.000 | 0.000 |
0.000 0.000 | 0.000 |
0.487 0.356 | 0.577 |
0.009 0.000 | 0.082 |
0.150 0.038 | 0.226 |
0.301 0.260 | 0.335 |
0.053 0.023 | 0.079 |
||
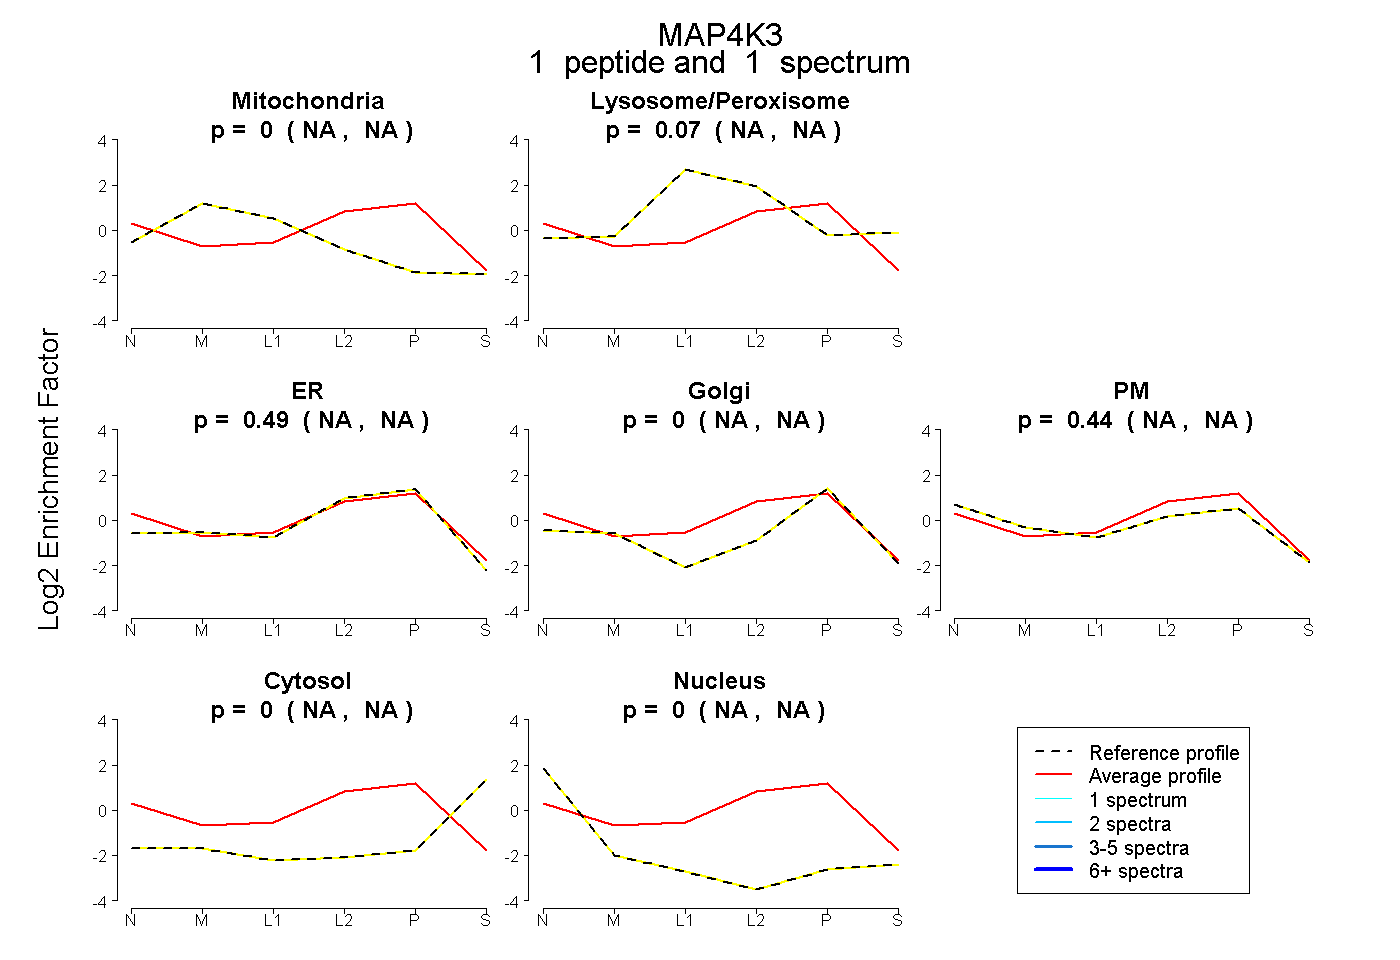
| Plot | Mito | Lyso or Perox | ER | Golgi | PM | Cytosol | Nucleus | ||||||
| Expt B |
1 peptide |
1 spectrum |
|
0.000 NA | NA |
0.070 NA | NA |
0.492 NA | NA |
0.000 NA | NA |
0.438 NA | NA |
0.000 NA | NA |
0.000 NA | NA |