 3
3peptides
spectra
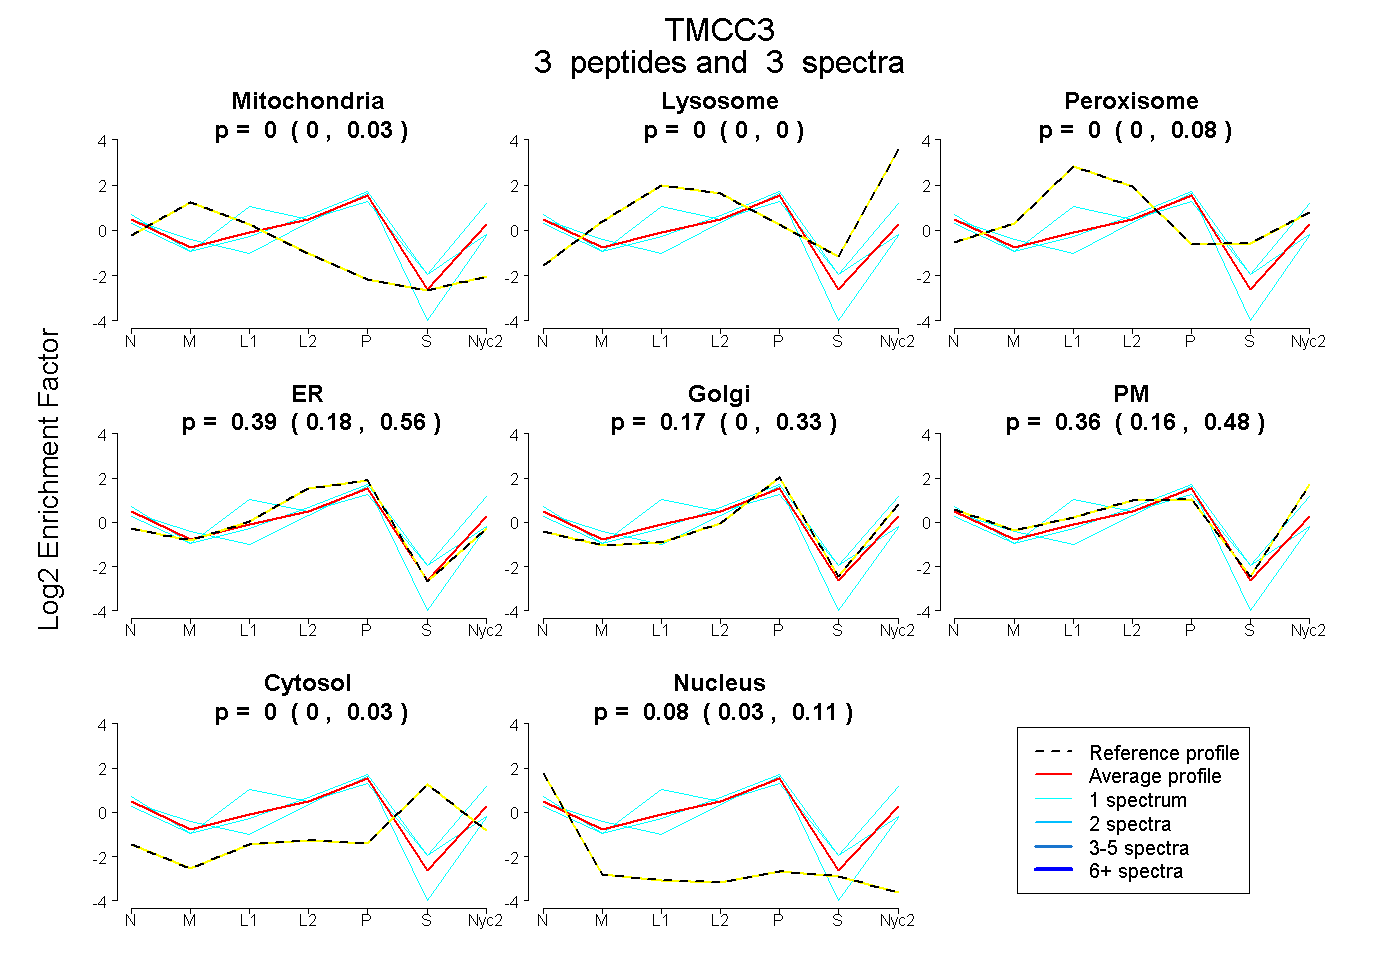
0.000 | 0.035
0.000 | 0.000
0.000 | 0.082
0.176 | 0.556
0.003 | 0.334
0.162 | 0.477
0.000 | 0.029
0.031 | 0.108
| Plot | Mito | Lyso | Perox | ER | Golgi | PM | Cytosol | Nucleus | |||||
| Expt A |
3 peptides |
3 spectra |
|
0.000 0.000 | 0.035 |
0.000 0.000 | 0.000 |
0.000 0.000 | 0.082 |
0.392 0.176 | 0.556 |
0.166 0.003 | 0.334 |
0.365 0.162 | 0.477 |
0.000 0.000 | 0.029 |
0.078 0.031 | 0.108 |
| 1 spectrum, DIQEALESCQTR | 0.000 | 0.000 | 0.194 | 0.000 | 0.200 | 0.585 | 0.000 | 0.021 | ||
| 1 spectrum, VTQAQLAEDIEALK | 0.009 | 0.000 | 0.000 | 0.475 | 0.294 | 0.096 | 0.000 | 0.126 | ||
| 1 spectrum, LAIILEELR | 0.000 | 0.000 | 0.000 | 0.573 | 0.191 | 0.121 | 0.068 | 0.047 |
| Plot | Lyso | Other | |||||||||||
| Expt C |
2 peptides |
3 spectra |
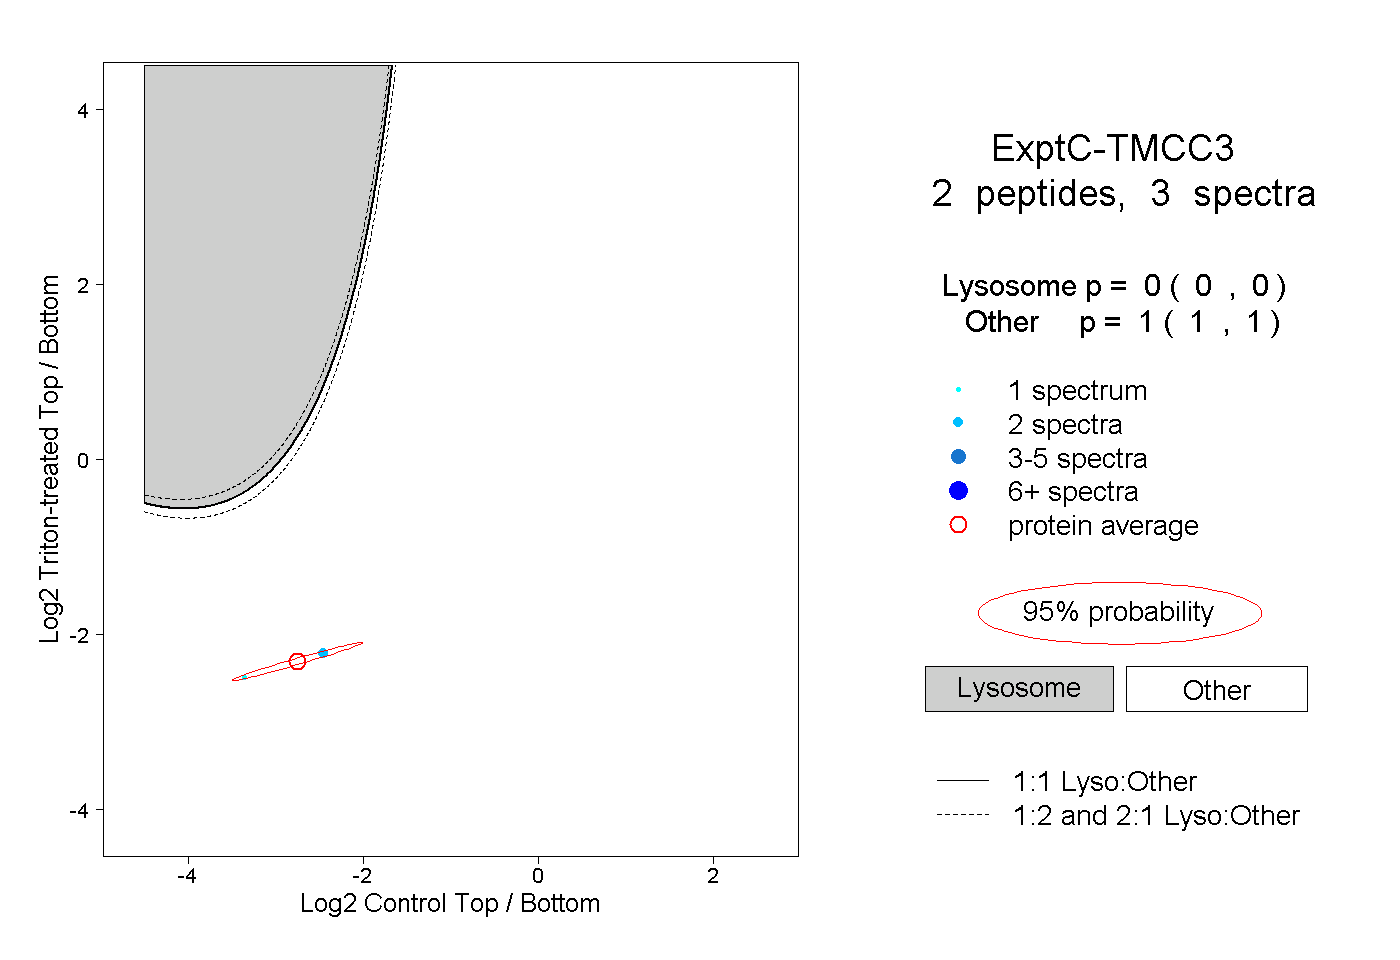 |
0.000 0.000 | 0.000 |
1.000 1.000 | 1.000 |