12
12peptides
spectra

0.000 | 0.000
0.015 | 0.022
0.000 | 0.000
0.000 | 0.000
0.000 | 0.000
0.294 | 0.301
0.682 | 0.686
0.000 | 0.000
5peptides
spectra
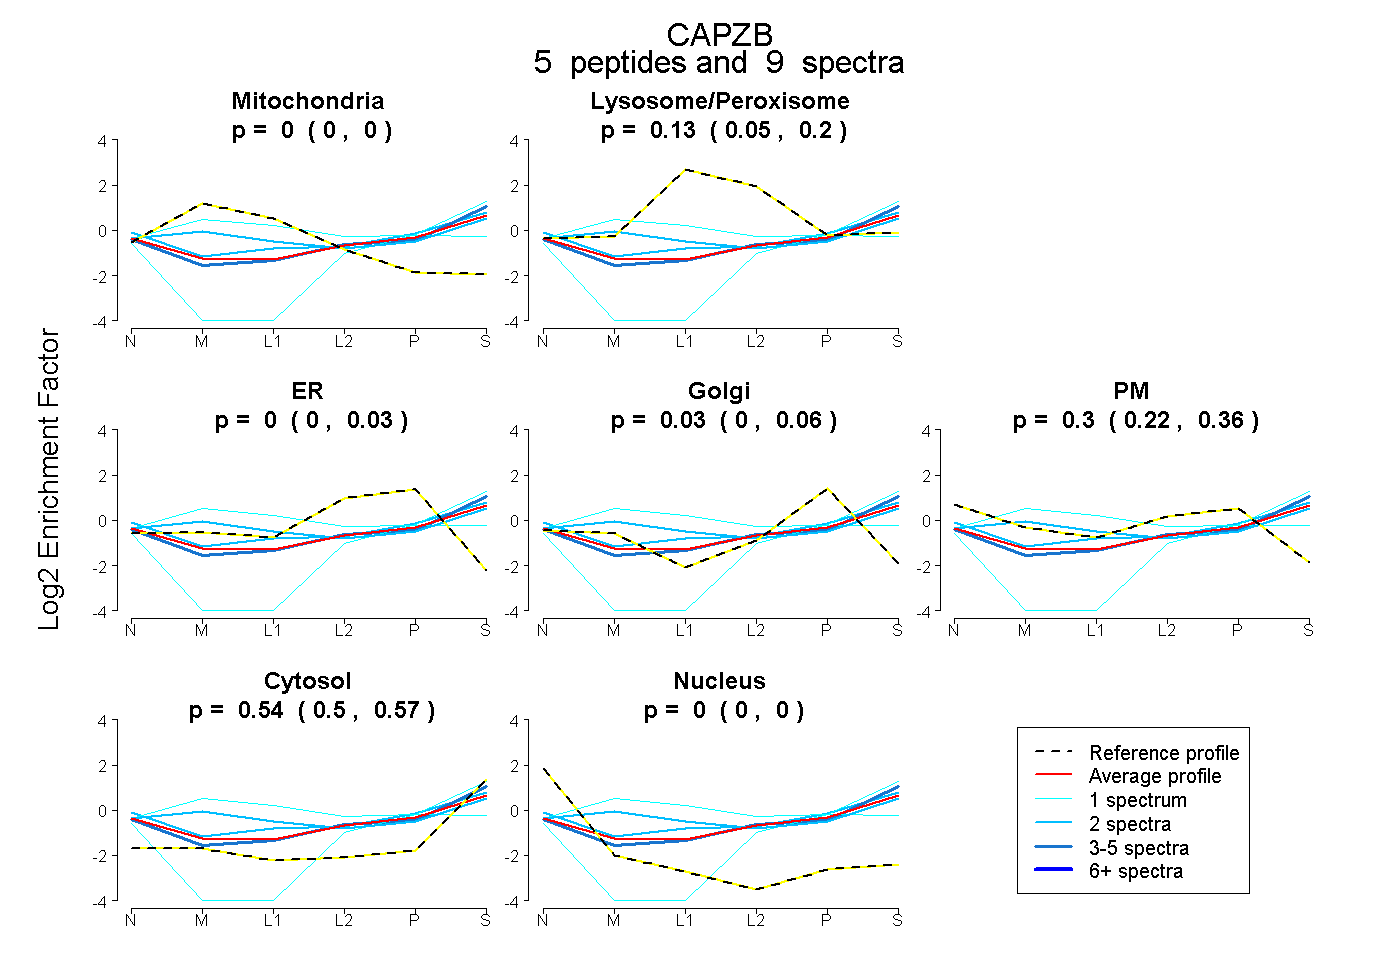
0.000 | 0.000
0.047 | 0.202
0.000 | 0.031
0.000 | 0.059
0.222 | 0.365
0.496 | 0.573
0.000 | 0.000