 12
12peptides
spectra

0.000 | 0.000
0.015 | 0.022
0.000 | 0.000
0.000 | 0.000
0.000 | 0.000
0.294 | 0.301
0.682 | 0.686
0.000 | 0.000
| Plot | Mito | Lyso | Perox | ER | Golgi | PM | Cytosol | Nucleus | |||||
| Expt A |
12 peptides |
62 spectra |
|
0.000 0.000 | 0.000 |
0.018 0.015 | 0.022 |
0.000 0.000 | 0.000 |
0.000 0.000 | 0.000 |
0.000 0.000 | 0.000 |
0.298 0.294 | 0.301 |
0.684 0.682 | 0.686 |
0.000 0.000 | 0.000 |
| 23 spectra, LVEDMENK | 0.000 | 0.051 | 0.000 | 0.000 | 0.000 | 0.282 | 0.667 | 0.000 | ||
| 12 spectra, SGSGTMNLGGSLTR | 0.000 | 0.036 | 0.000 | 0.000 | 0.000 | 0.282 | 0.682 | 0.000 | ||
| 1 spectrum, SDQQLDCALDLMR | 0.000 | 0.000 | 0.071 | 0.000 | 0.000 | 0.330 | 0.599 | 0.000 | ||
| 6 spectra, DIVNGLR | 0.000 | 0.029 | 0.000 | 0.000 | 0.000 | 0.326 | 0.645 | 0.000 | ||
| 2 spectra, DGDSYR | 0.000 | 0.000 | 0.000 | 0.000 | 0.000 | 0.214 | 0.786 | 0.000 | ||
| 1 spectrum, YDPPLEDGAMPSAR | 0.000 | 0.060 | 0.000 | 0.000 | 0.000 | 0.152 | 0.787 | 0.000 | ||
| 2 spectra, NDLVEALK | 0.000 | 0.005 | 0.000 | 0.000 | 0.000 | 0.260 | 0.734 | 0.000 | ||
| 3 spectra, SPWSNK | 0.000 | 0.022 | 0.000 | 0.000 | 0.078 | 0.265 | 0.635 | 0.000 | ||
| 1 spectrum, DYLLCDYNR | 0.000 | 0.000 | 0.000 | 0.000 | 0.000 | 0.188 | 0.794 | 0.018 | ||
| 1 spectrum, LEVEANNAFDQYR | 0.000 | 0.000 | 0.099 | 0.000 | 0.000 | 0.329 | 0.571 | 0.000 | ||
| 5 spectra, STLNEIYFGK | 0.000 | 0.085 | 0.007 | 0.000 | 0.000 | 0.268 | 0.640 | 0.000 | ||
| 5 spectra, SVQTFADK | 0.000 | 0.001 | 0.002 | 0.000 | 0.000 | 0.316 | 0.681 | 0.000 |
| Plot | Mito | Lyso or Perox | ER | Golgi | PM | Cytosol | Nucleus | ||||||
| Expt B |
5 peptides |
9 spectra |
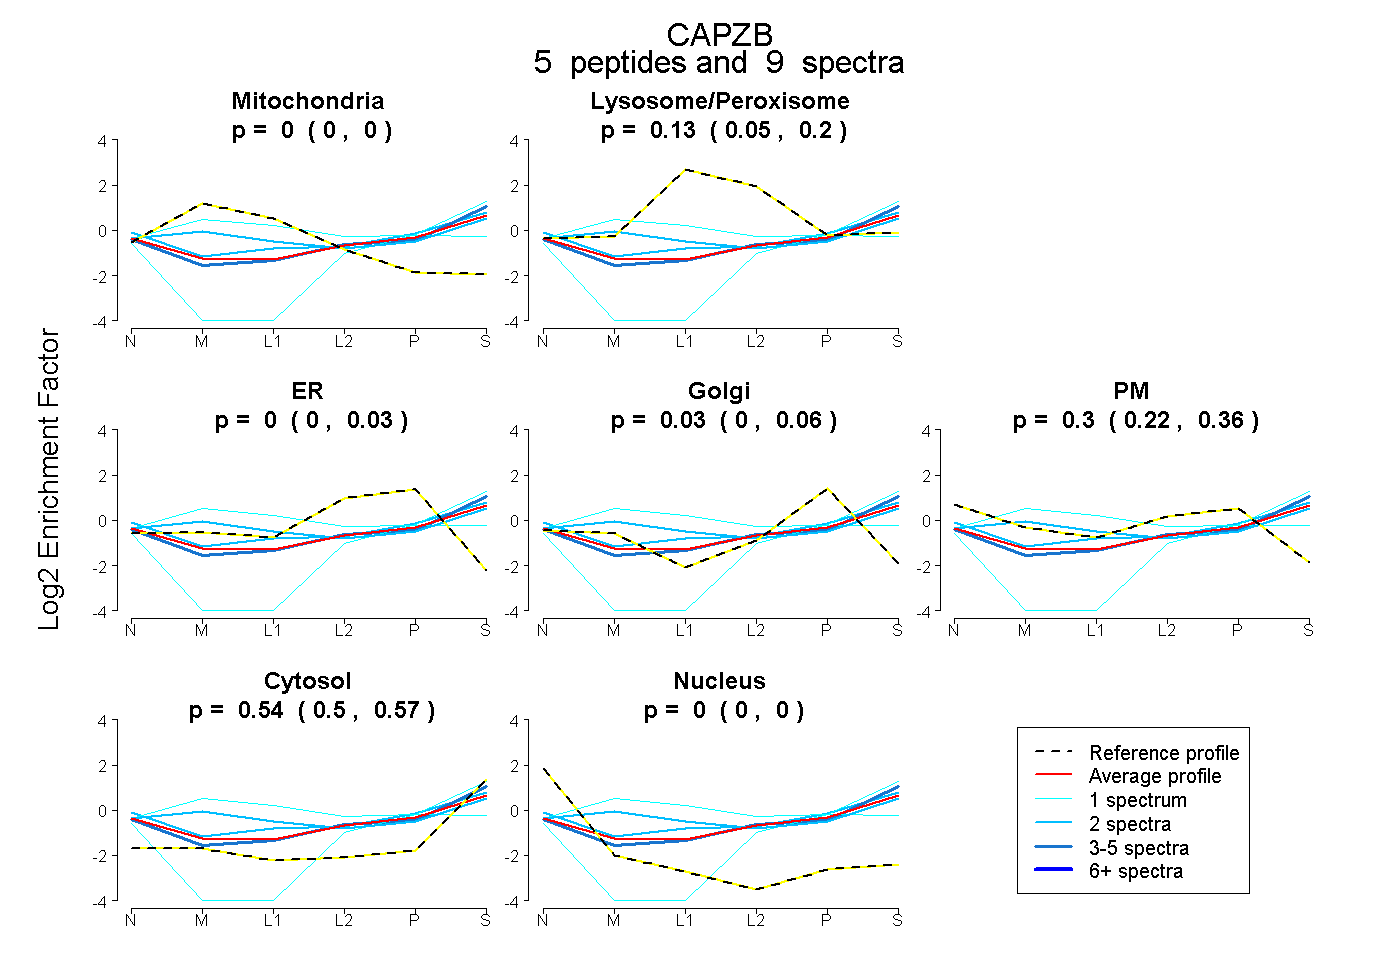 |
0.000 0.000 | 0.000 |
0.134 0.047 | 0.202 |
0.000 0.000 | 0.031 |
0.028 0.000 | 0.059 |
0.301 0.222 | 0.365 |
0.537 0.496 | 0.573 |
0.000 0.000 | 0.000 |
|||
| Plot | Lyso | Other | |||||||||||
| Expt C |
10 peptides |
52 spectra |
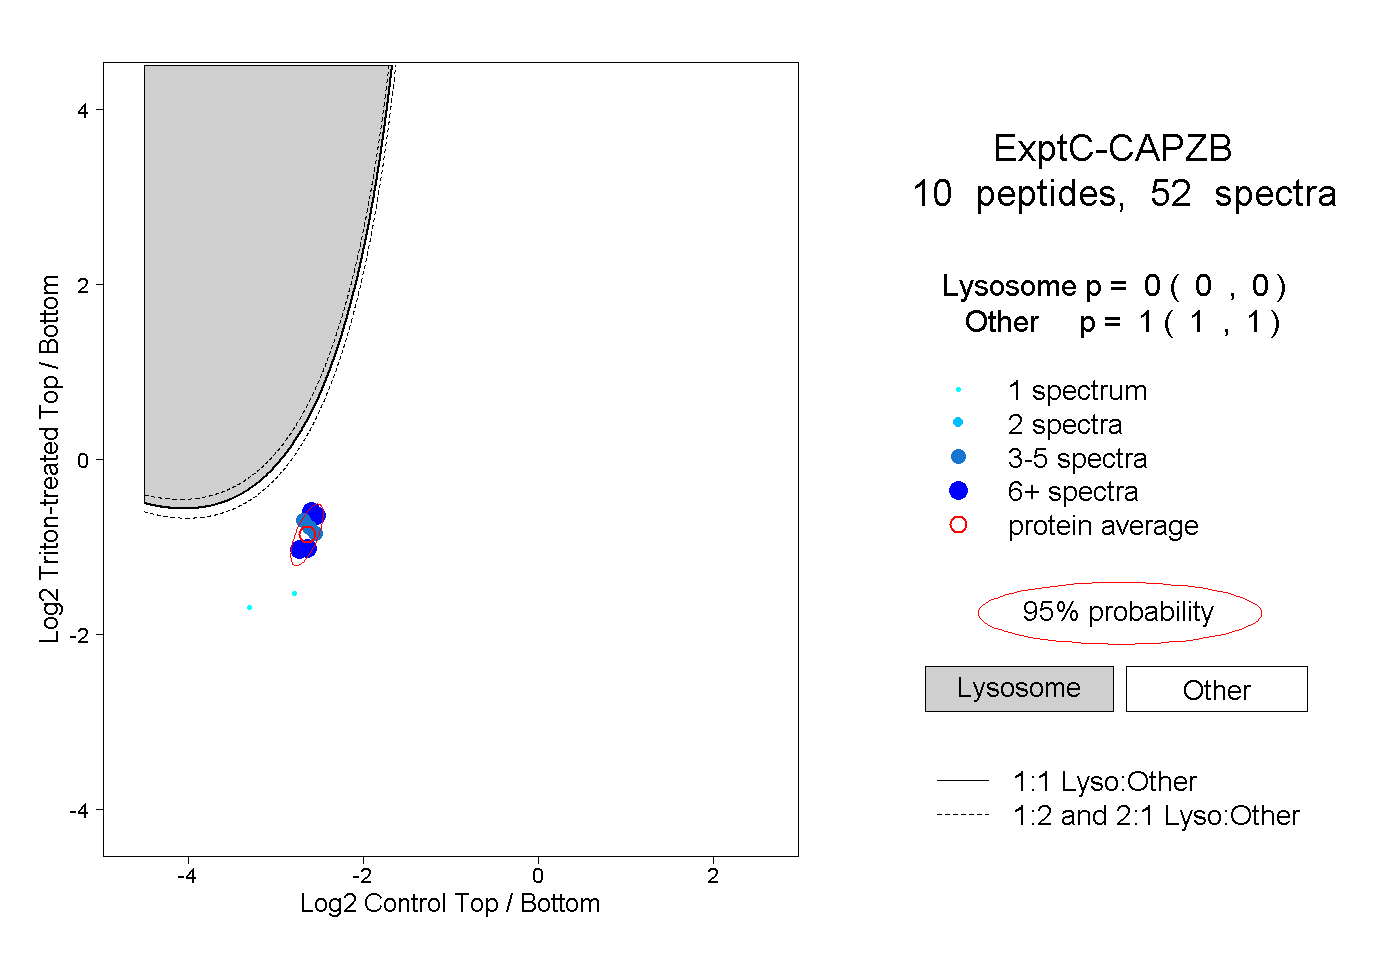 |
0.000 0.000 | 0.000 |
1.000 1.000 | 1.000 |
||||||||
| Plot | Lyso | Other | |||||||||||
| Expt D |
5 peptides |
8 spectra |
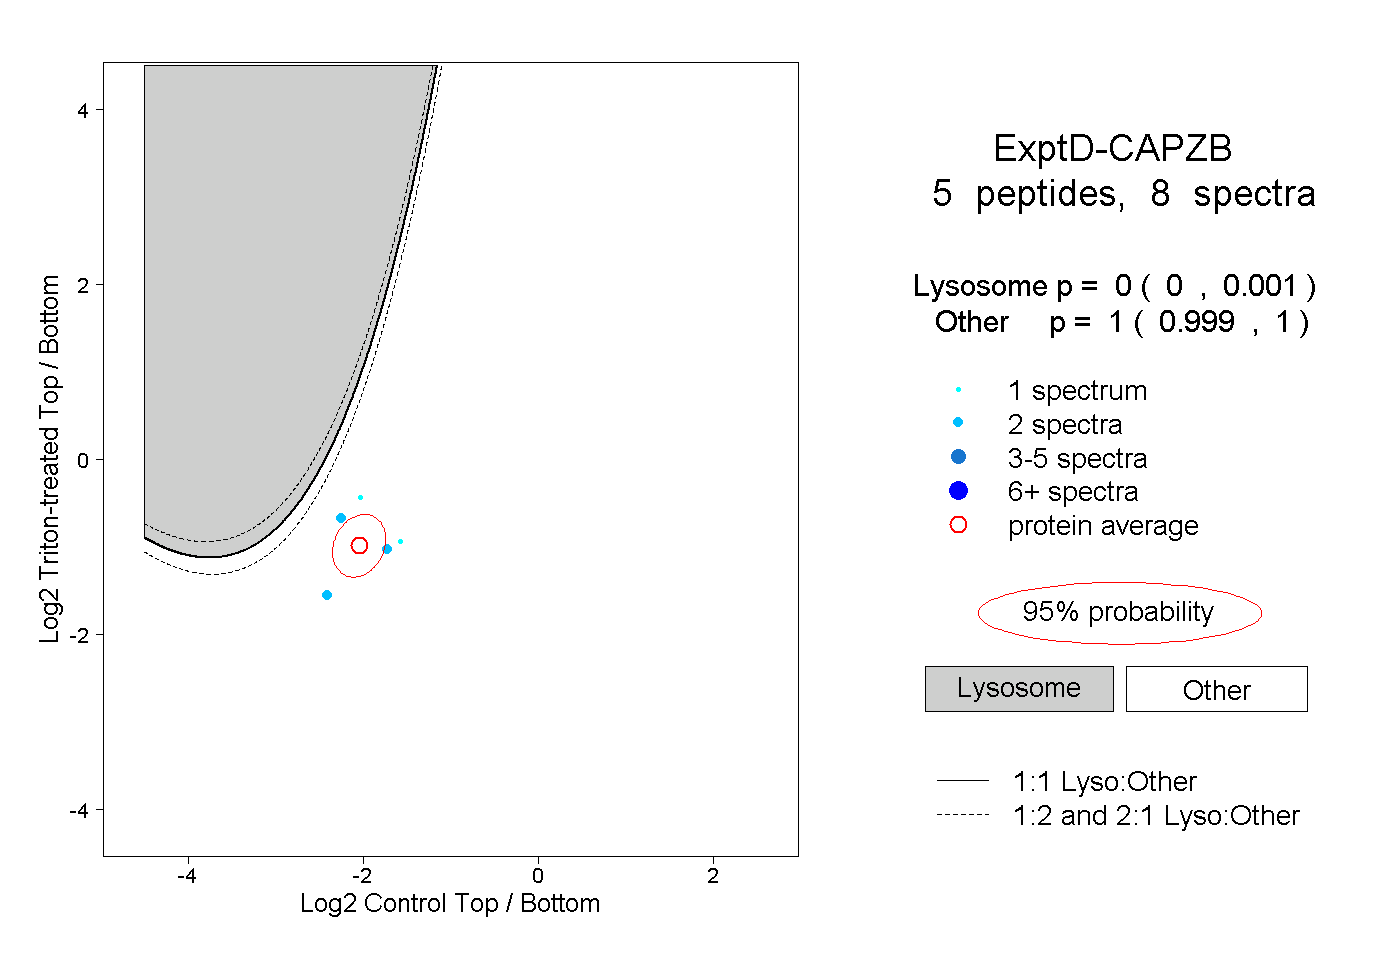 |
0.000 0.000 | 0.001 |
1.000 0.999 | 1.000 |