 11
11peptides
spectra
0.000 | 0.000
0.000 | 0.024
0.000 | 0.059
0.000 | 0.000
0.047 | 0.146
0.055 | 0.184
0.719 | 0.752
0.000 | 0.000
| Plot | Mito | Lyso | Perox | ER | Golgi | PM | Cytosol | Nucleus | |||||
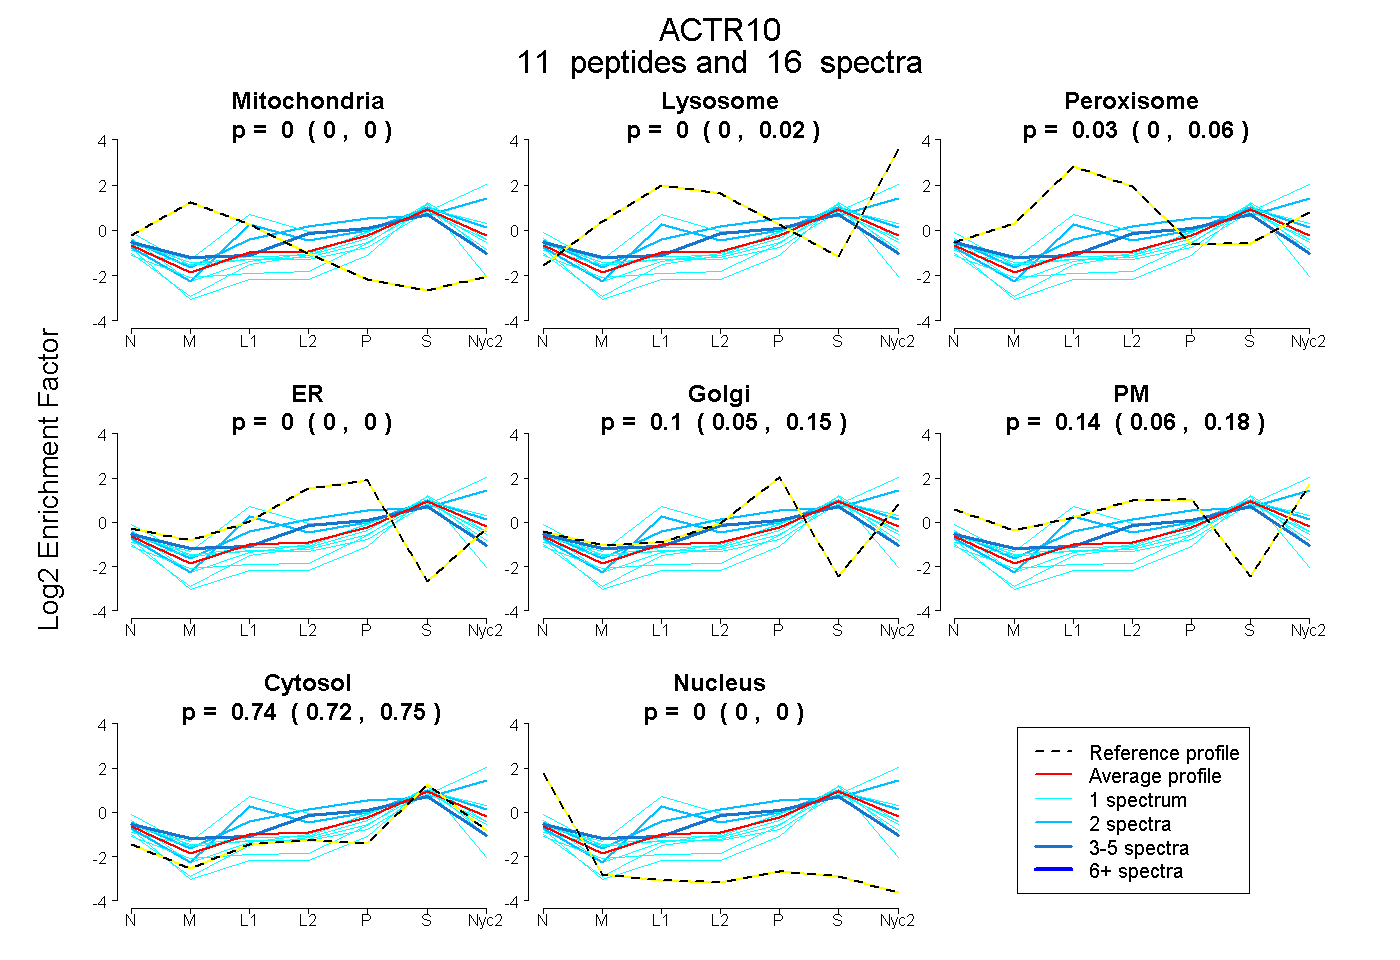
| Expt A |
11 peptides |
16 spectra |
|
0.000 0.000 | 0.000 |
0.000 0.000 | 0.024 |
0.027 0.000 | 0.059 |
0.000 0.000 | 0.000 |
0.096 0.047 | 0.146 |
0.138 0.055 | 0.184 |
0.739 0.719 | 0.752 |
0.000 0.000 | 0.000 |
| 2 spectra, CGFAGETGPR | 0.000 | 0.264 | 0.000 | 0.000 | 0.090 | 0.165 | 0.481 | 0.000 | ||
| 4 spectra, VVVIESVLCPSHFR | 0.005 | 0.000 | 0.033 | 0.315 | 0.000 | 0.000 | 0.648 | 0.000 | ||
| 1 spectrum, TQPPLMK | 0.000 | 0.532 | 0.000 | 0.000 | 0.000 | 0.004 | 0.464 | 0.000 | ||
| 1 spectrum, LLAEIR | 0.000 | 0.028 | 0.000 | 0.000 | 0.000 | 0.217 | 0.754 | 0.000 | ||
| 1 spectrum, DSVVEILFEQDNEEK | 0.000 | 0.000 | 0.000 | 0.000 | 0.222 | 0.020 | 0.755 | 0.003 | ||
| 1 spectrum, CIIPSVIK | 0.014 | 0.000 | 0.025 | 0.030 | 0.187 | 0.000 | 0.745 | 0.000 | ||
| 1 spectrum, TAVVIDLGEAFTK | 0.000 | 0.000 | 0.000 | 0.068 | 0.000 | 0.000 | 0.857 | 0.075 | ||
| 1 spectrum, EFIHILYFR | 0.000 | 0.000 | 0.000 | 0.000 | 0.000 | 0.000 | 0.916 | 0.084 | ||
| 1 spectrum, HLLVNPR | 0.000 | 0.000 | 0.000 | 0.000 | 0.077 | 0.000 | 0.872 | 0.051 | ||
| 1 spectrum, GQSLPSVMGSVPESVLEDIK | 0.009 | 0.000 | 0.000 | 0.000 | 0.000 | 0.204 | 0.730 | 0.057 | ||
| 2 spectra, EYYNQTGR | 0.000 | 0.049 | 0.224 | 0.000 | 0.106 | 0.000 | 0.621 | 0.000 |
| Plot | Mito | Lyso or Perox | ER | Golgi | PM | Cytosol | Nucleus | ||||||
| Expt B |
1 peptide |
2 spectra |
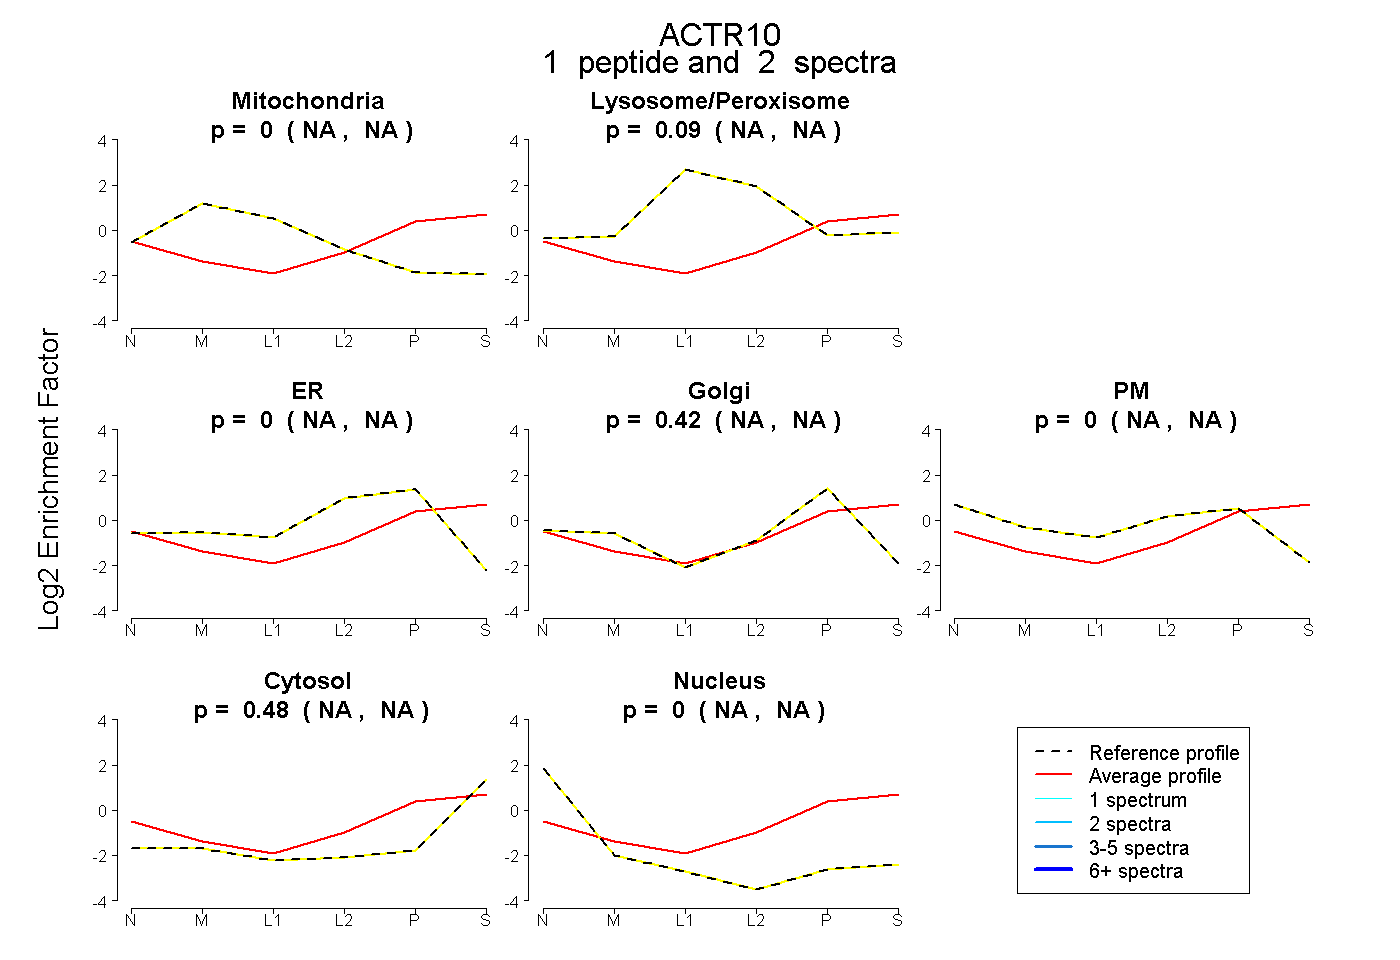 |
0.000 NA | NA |
0.094 NA | NA |
0.000 NA | NA |
0.421 NA | NA |
0.000 NA | NA |
0.485 NA | NA |
0.000 NA | NA |
|||
| Plot | Lyso | Other | |||||||||||
| Expt C |
5 peptides |
9 spectra |
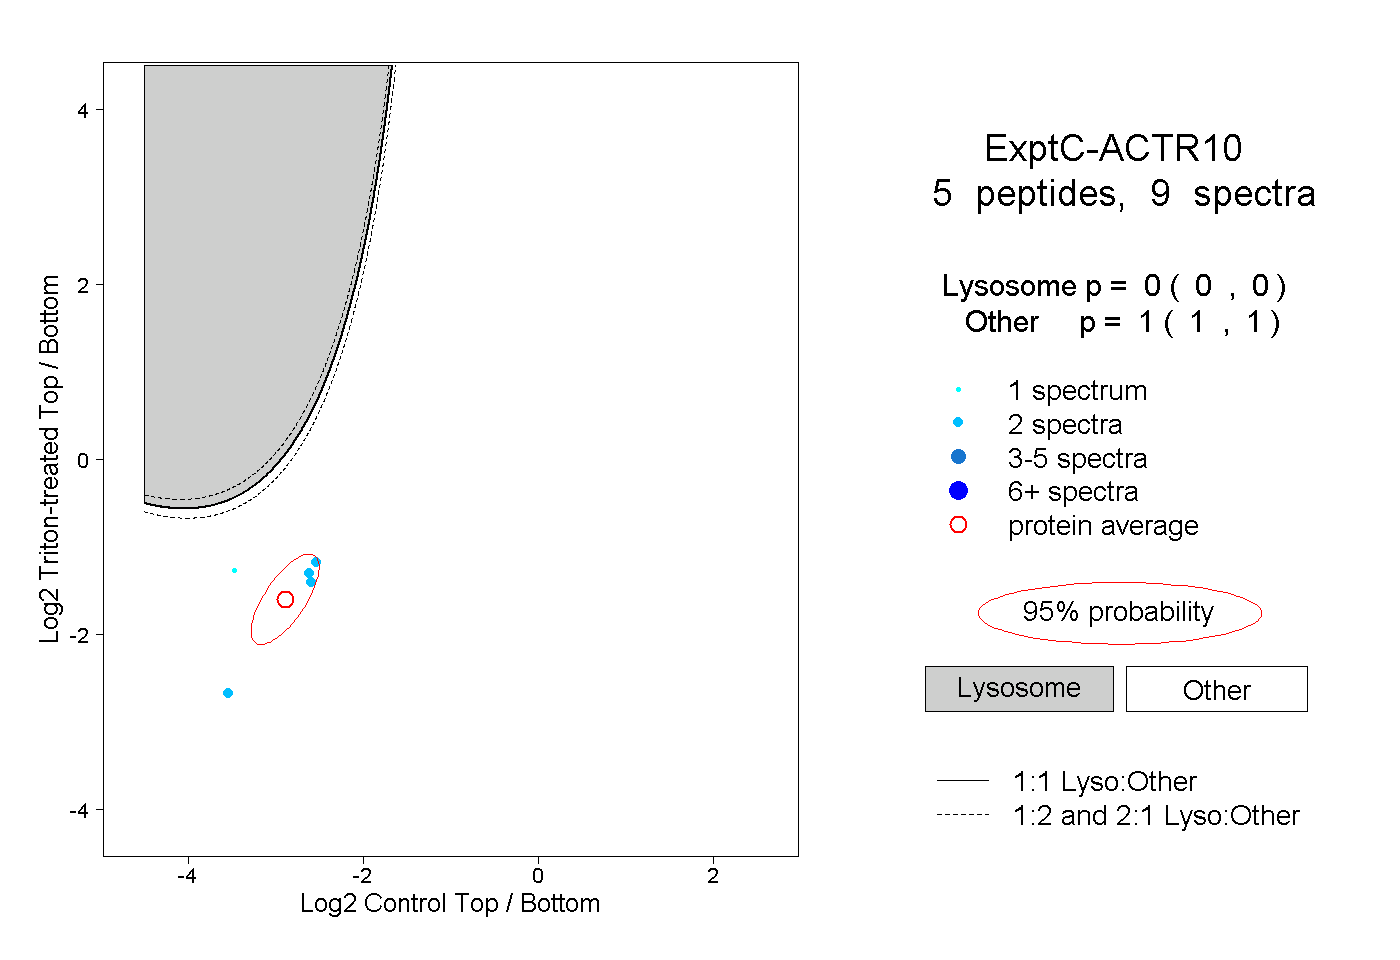 |
0.000 0.000 | 0.000 |
1.000 1.000 | 1.000 |