 4
4peptides
spectra
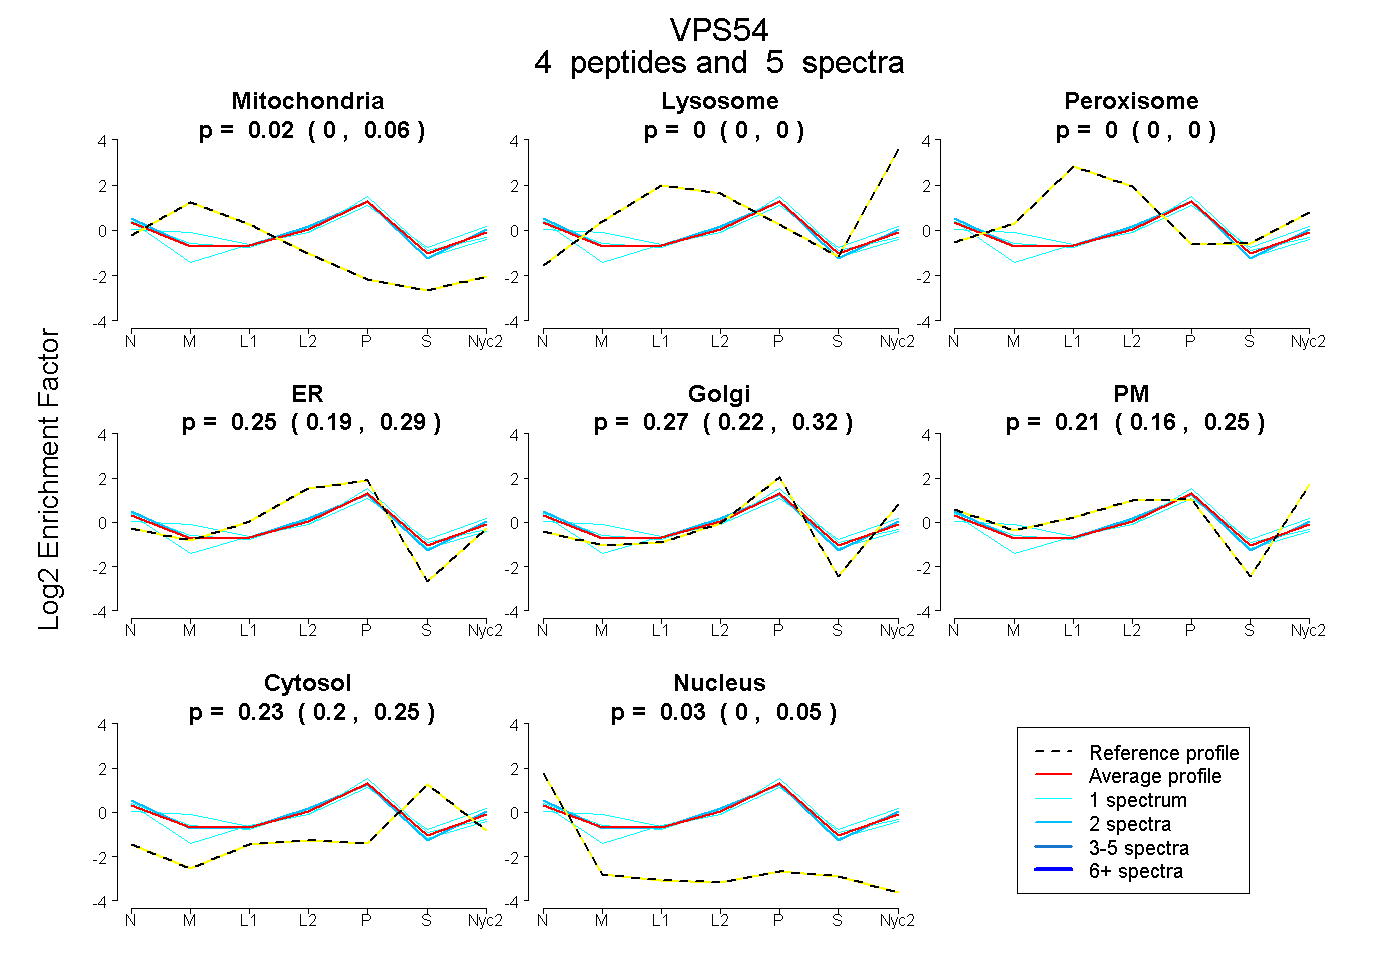
0.000 | 0.060
0.000 | 0.000
0.000 | 0.000
0.191 | 0.293
0.217 | 0.319
0.157 | 0.248
0.202 | 0.247
0.000 | 0.045
| Plot | Mito | Lyso | Perox | ER | Golgi | PM | Cytosol | Nucleus | |||||
| Expt A |
4 peptides |
5 spectra |
|
0.015 0.000 | 0.060 |
0.000 0.000 | 0.000 |
0.000 0.000 | 0.000 |
0.248 0.191 | 0.293 |
0.267 0.217 | 0.319 |
0.212 0.157 | 0.248 |
0.228 0.202 | 0.247 |
0.029 0.000 | 0.045 |
| 2 spectra, QWSLLR | 0.000 | 0.000 | 0.000 | 0.238 | 0.209 | 0.318 | 0.180 | 0.055 | ||
| 1 spectrum, TLLHIHDK | 0.000 | 0.000 | 0.000 | 0.307 | 0.352 | 0.048 | 0.257 | 0.037 | ||
| 1 spectrum, HFDHITK | 0.086 | 0.000 | 0.108 | 0.000 | 0.495 | 0.120 | 0.191 | 0.000 | ||
| 1 spectrum, LSLLLDNER | 0.041 | 0.000 | 0.000 | 0.342 | 0.236 | 0.141 | 0.185 | 0.055 |
| Plot | Lyso | Other | |||||||||||
| Expt C |
1 peptide |
1 spectrum |
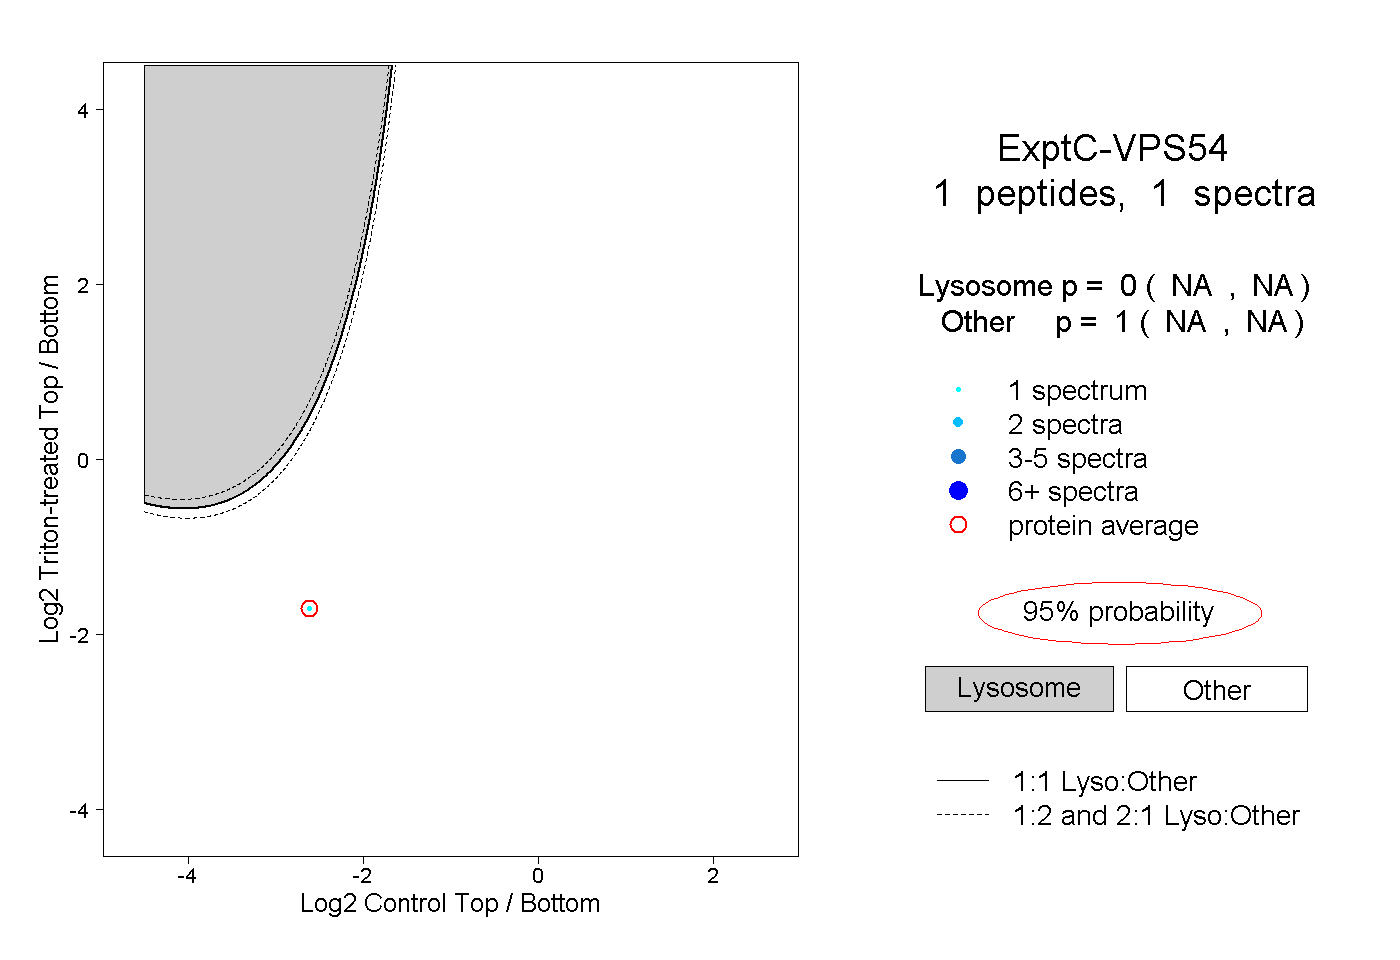 |
0.000 NA | NA |
1.000 NA | NA |